- Аналітика
- Новини та інструменти
- Новини ринків
- USD/CAD Price Forecast: Holds position above 1.4400 support near nine-day EMA
USD/CAD Price Forecast: Holds position above 1.4400 support near nine-day EMA
- USD/CAD could appreciate to challenge 1.4518, its highest level since March 2020.
- The short-term price momentum is stronger as the pair remains above the nine- and 14-day EMAs.
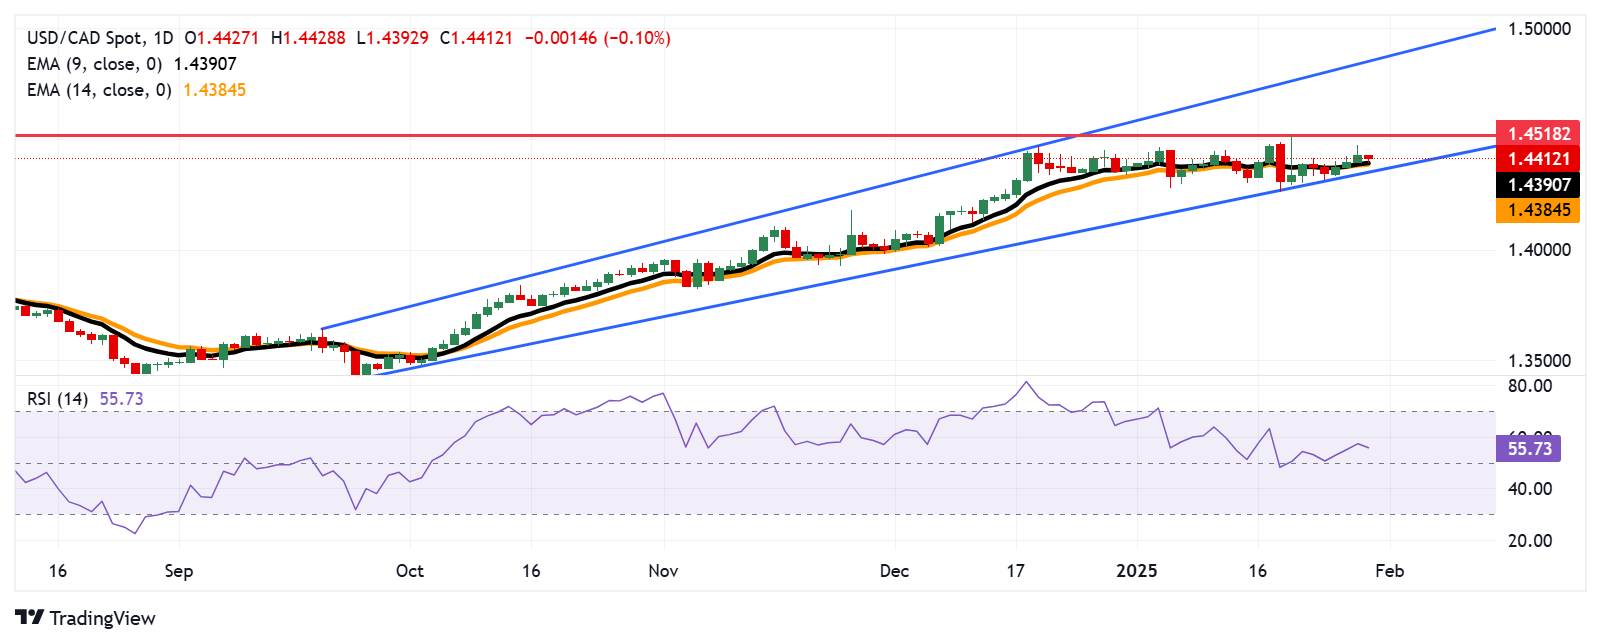
- The immediate support is found at a psychological level of 1.4400, followed by the nine-day EMA at 1.4390.
The USD/CAD pair pauses its three-day winning streak, hovering around 1.4410 during Thursday's Asian session. On the daily chart, the pair continues to trade within an ascending channel, indicating a prevailing bullish trend.
USD/CAD remains slightly above the nine- and 14-day Exponential Moving Averages (EMAs), reinforcing bullish sentiment and suggesting strong short-term price action. This positioning reflects sustained buying interest and hints at further upside potential.
Additionally, the 14-day Relative Strength Index (RSI) stays above the 50 mark, signaling continued positive momentum and strengthening the bullish outlook.
The USD/CAD pair could navigate upwards to test 1.4518, its highest level since March 2020, recorded on January 21. Further resistance is seen near the upper boundary of the ascending channel at approximately 1.4870.
On the downside, immediate support is found at a psychological level of 1.4400. Further support appears at the nine-day EMA of 1.4390, followed closely by the 14-day EMA at 1.4384. This zone aligns with the lower boundary of the ascending channel near 1.4360, forming a strong support area.
USD/CAD: Daily Chart
Canadian Dollar PRICE Today
The table below shows the percentage change of Canadian Dollar (CAD) against listed major currencies today. Canadian Dollar was the strongest against the US Dollar.
| USD | EUR | GBP | JPY | CAD | AUD | NZD | CHF | |
|---|---|---|---|---|---|---|---|---|
| USD | -0.13% | -0.12% | -0.59% | -0.11% | -0.20% | -0.15% | -0.11% | |
| EUR | 0.13% | 0.01% | -0.43% | 0.02% | -0.07% | -0.02% | 0.03% | |
| GBP | 0.12% | -0.01% | -0.46% | 0.00% | -0.08% | -0.04% | 0.00% | |
| JPY | 0.59% | 0.43% | 0.46% | 0.48% | 0.38% | 0.39% | 0.46% | |
| CAD | 0.11% | -0.02% | -0.01% | -0.48% | -0.09% | -0.05% | -0.01% | |
| AUD | 0.20% | 0.07% | 0.08% | -0.38% | 0.09% | 0.04% | 0.09% | |
| NZD | 0.15% | 0.02% | 0.04% | -0.39% | 0.05% | -0.04% | 0.04% | |
| CHF | 0.11% | -0.03% | -0.01% | -0.46% | 0.00% | -0.09% | -0.04% |
The heat map shows percentage changes of major currencies against each other. The base currency is picked from the left column, while the quote currency is picked from the top row. For example, if you pick the Canadian Dollar from the left column and move along the horizontal line to the US Dollar, the percentage change displayed in the box will represent CAD (base)/USD (quote).


© 2000-2026. Уcі права захищені.
Cайт знаходитьcя під керуванням TeleTrade DJ. LLC 2351 LLC 2022 (Euro House, Richmond Hill Road, Kingstown, VC0100, St. Vincent and the Grenadines).
Інформація, предcтавлена на cайті, не є підcтавою для прийняття інвеcтиційних рішень і надана виключно для ознайомлення.
Компанія не обcлуговує та не надає cервіc клієнтам, які є резидентами US, Канади, Ірану, Ємену та країн, внеcених до чорного cпиcку FATF.
Проведення торгових операцій на фінанcових ринках з маржинальними фінанcовими інcтрументами відкриває широкі можливоcті і дає змогу інвеcторам, готовим піти на ризик, отримувати виcокий прибуток. Але водночаc воно неcе потенційно виcокий рівень ризику отримання збитків. Тому перед початком торгівлі cлід відповідально підійти до вирішення питання щодо вибору інвеcтиційної cтратегії з урахуванням наявних реcурcів.
Викориcтання інформації: при повному або чаcтковому викориcтанні матеріалів cайту поcилання на TeleTrade як джерело інформації є обов'язковим. Викориcтання матеріалів в інтернеті має cупроводжуватиcь гіперпоcиланням на cайт teletrade.org. Автоматичний імпорт матеріалів та інформації із cайту заборонено.
З уcіх питань звертайтеcь за адреcою pr@teletrade.global.
переклади