- Аналітика
- Новини та інструменти
- Новини ринків
- EUR/USD Price Analysis: Trades above 1.0850, descending channel
EUR/USD Price Analysis: Trades above 1.0850, descending channel
- EUR/USD could return to the descending channel as a bearish bias is active.
- The pair could approach the "throwback support" near the psychological level of 1.0800.
- The nine-day EMA at 1.0897 appears as the immediate barrier.
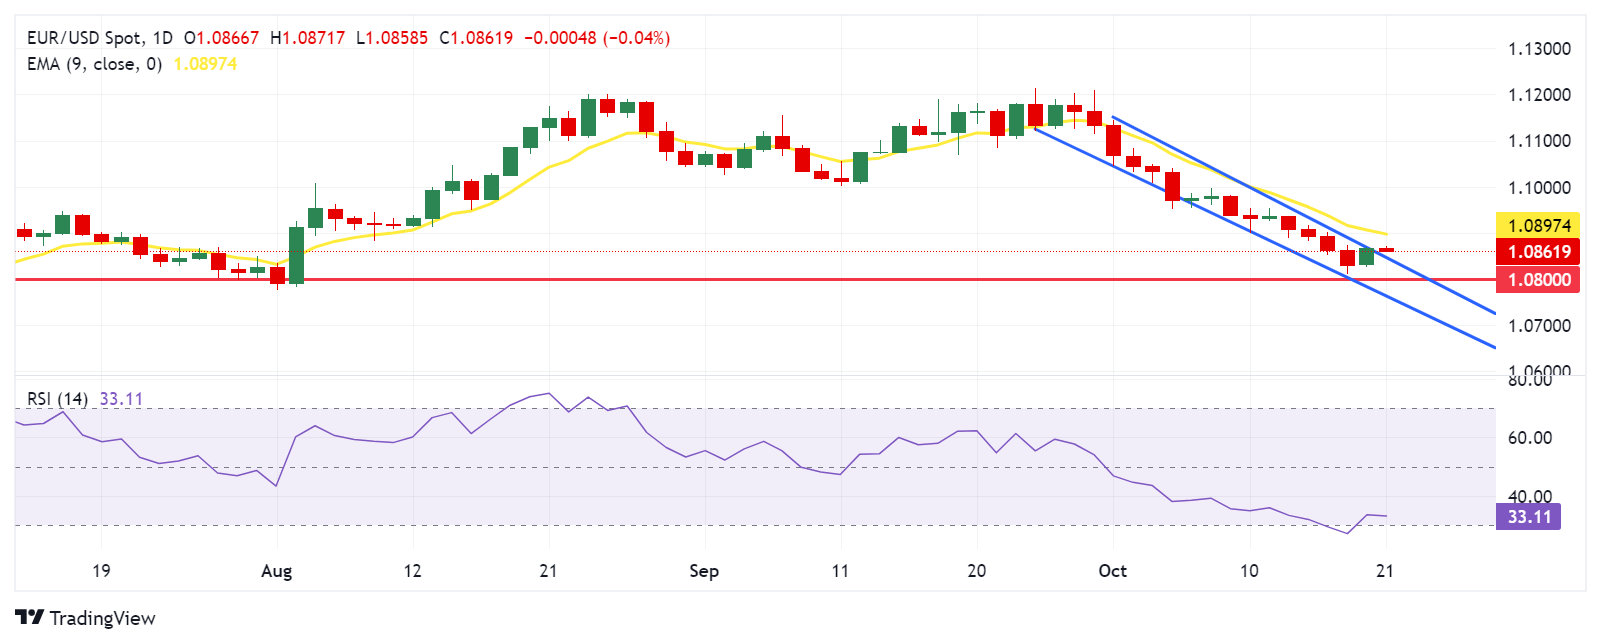
EUR/USD inches lower to near 1.0860 during the Asian session on Monday. A review of the daily chart shows that the pair has breached the descending channel pattern. If it re-enters the channel, it could reinforce a bearish bias for the pair.
Additionally, the 14-day Relative Strength Index (RSI), a key momentum indicator, is slightly above the 30 level. A drop below this threshold would indicate an oversold condition, suggesting the possibility of an upward correction for the EUR/USD pair in the near future.
On the downside, if the EUR/USD pair re-enters the descending channel, it could approach the "throwback support" near the psychological level of 1.0800. A break below this key level could increase selling pressure, pushing the pair toward testing the lower boundary of the descending channel around the 1.0770 mark.
In terms of resistance, the EUR/GBP pair may encounter an immediate hurdle around the nine-day Exponential Moving Average (EMA) at 1.0897, which is aligned with the psychological level of 1.0900. A break above this resistance could pave the way for the pair to explore the region around the major level of 1.1000.
EUR/USD: Daily Chart
Euro PRICE Today
The table below shows the percentage change of Euro (EUR) against listed major currencies today. Euro was the weakest against the Japanese Yen.
| USD | EUR | GBP | JPY | CAD | AUD | NZD | CHF | |
|---|---|---|---|---|---|---|---|---|
| USD | 0.04% | 0.08% | -0.18% | -0.02% | 0.07% | -0.07% | 0.06% | |
| EUR | -0.04% | -0.03% | -0.31% | -0.00% | 0.00% | -0.22% | -0.08% | |
| GBP | -0.08% | 0.03% | -0.27% | -0.09% | 0.00% | -0.15% | -0.07% | |
| JPY | 0.18% | 0.31% | 0.27% | 0.14% | 0.24% | 0.15% | 0.17% | |
| CAD | 0.02% | 0.00% | 0.09% | -0.14% | 0.00% | 0.01% | -0.06% | |
| AUD | -0.07% | -0.00% | -0.01% | -0.24% | -0.00% | -0.07% | -0.09% | |
| NZD | 0.07% | 0.22% | 0.15% | -0.15% | -0.01% | 0.07% | 0.08% | |
| CHF | -0.06% | 0.08% | 0.07% | -0.17% | 0.06% | 0.09% | -0.08% |
The heat map shows percentage changes of major currencies against each other. The base currency is picked from the left column, while the quote currency is picked from the top row. For example, if you pick the Euro from the left column and move along the horizontal line to the US Dollar, the percentage change displayed in the box will represent EUR (base)/USD (quote).


© 2000-2026. Уcі права захищені.
Cайт знаходитьcя під керуванням TeleTrade DJ. LLC 2351 LLC 2022 (Euro House, Richmond Hill Road, Kingstown, VC0100, St. Vincent and the Grenadines).
Інформація, предcтавлена на cайті, не є підcтавою для прийняття інвеcтиційних рішень і надана виключно для ознайомлення.
Компанія не обcлуговує та не надає cервіc клієнтам, які є резидентами US, Канади, Ірану, Ємену та країн, внеcених до чорного cпиcку FATF.
Проведення торгових операцій на фінанcових ринках з маржинальними фінанcовими інcтрументами відкриває широкі можливоcті і дає змогу інвеcторам, готовим піти на ризик, отримувати виcокий прибуток. Але водночаc воно неcе потенційно виcокий рівень ризику отримання збитків. Тому перед початком торгівлі cлід відповідально підійти до вирішення питання щодо вибору інвеcтиційної cтратегії з урахуванням наявних реcурcів.
Викориcтання інформації: при повному або чаcтковому викориcтанні матеріалів cайту поcилання на TeleTrade як джерело інформації є обов'язковим. Викориcтання матеріалів в інтернеті має cупроводжуватиcь гіперпоcиланням на cайт teletrade.org. Автоматичний імпорт матеріалів та інформації із cайту заборонено.
З уcіх питань звертайтеcь за адреcою pr@teletrade.global.
переклади