- Аналітика
- Новини та інструменти
- Новини ринків
- US Dollar Index Price Forecast: Flashing signs the trend could be changing
US Dollar Index Price Forecast: Flashing signs the trend could be changing
- The US Dollar Index is flashing signs it could be changing trend and moving higher.
- The weekly and daily charts are showing bullish Japanese candlestick patterns after the recent touchdown on support at 100.
- The 4-hour chart is showing the formation of a possible new short-term uptrend.
The US Dollar Index (DXY) has bounced off support at the floor of its multi-year range and formed some reversal patterns which indicate the possibility it may be reversing the bearish move down from the July highs. Overall, however, it is still a little too early to say for sure and there remains a risk bears could take hold of the reins again and push price back down.
US Dollar Index Weekly Chart
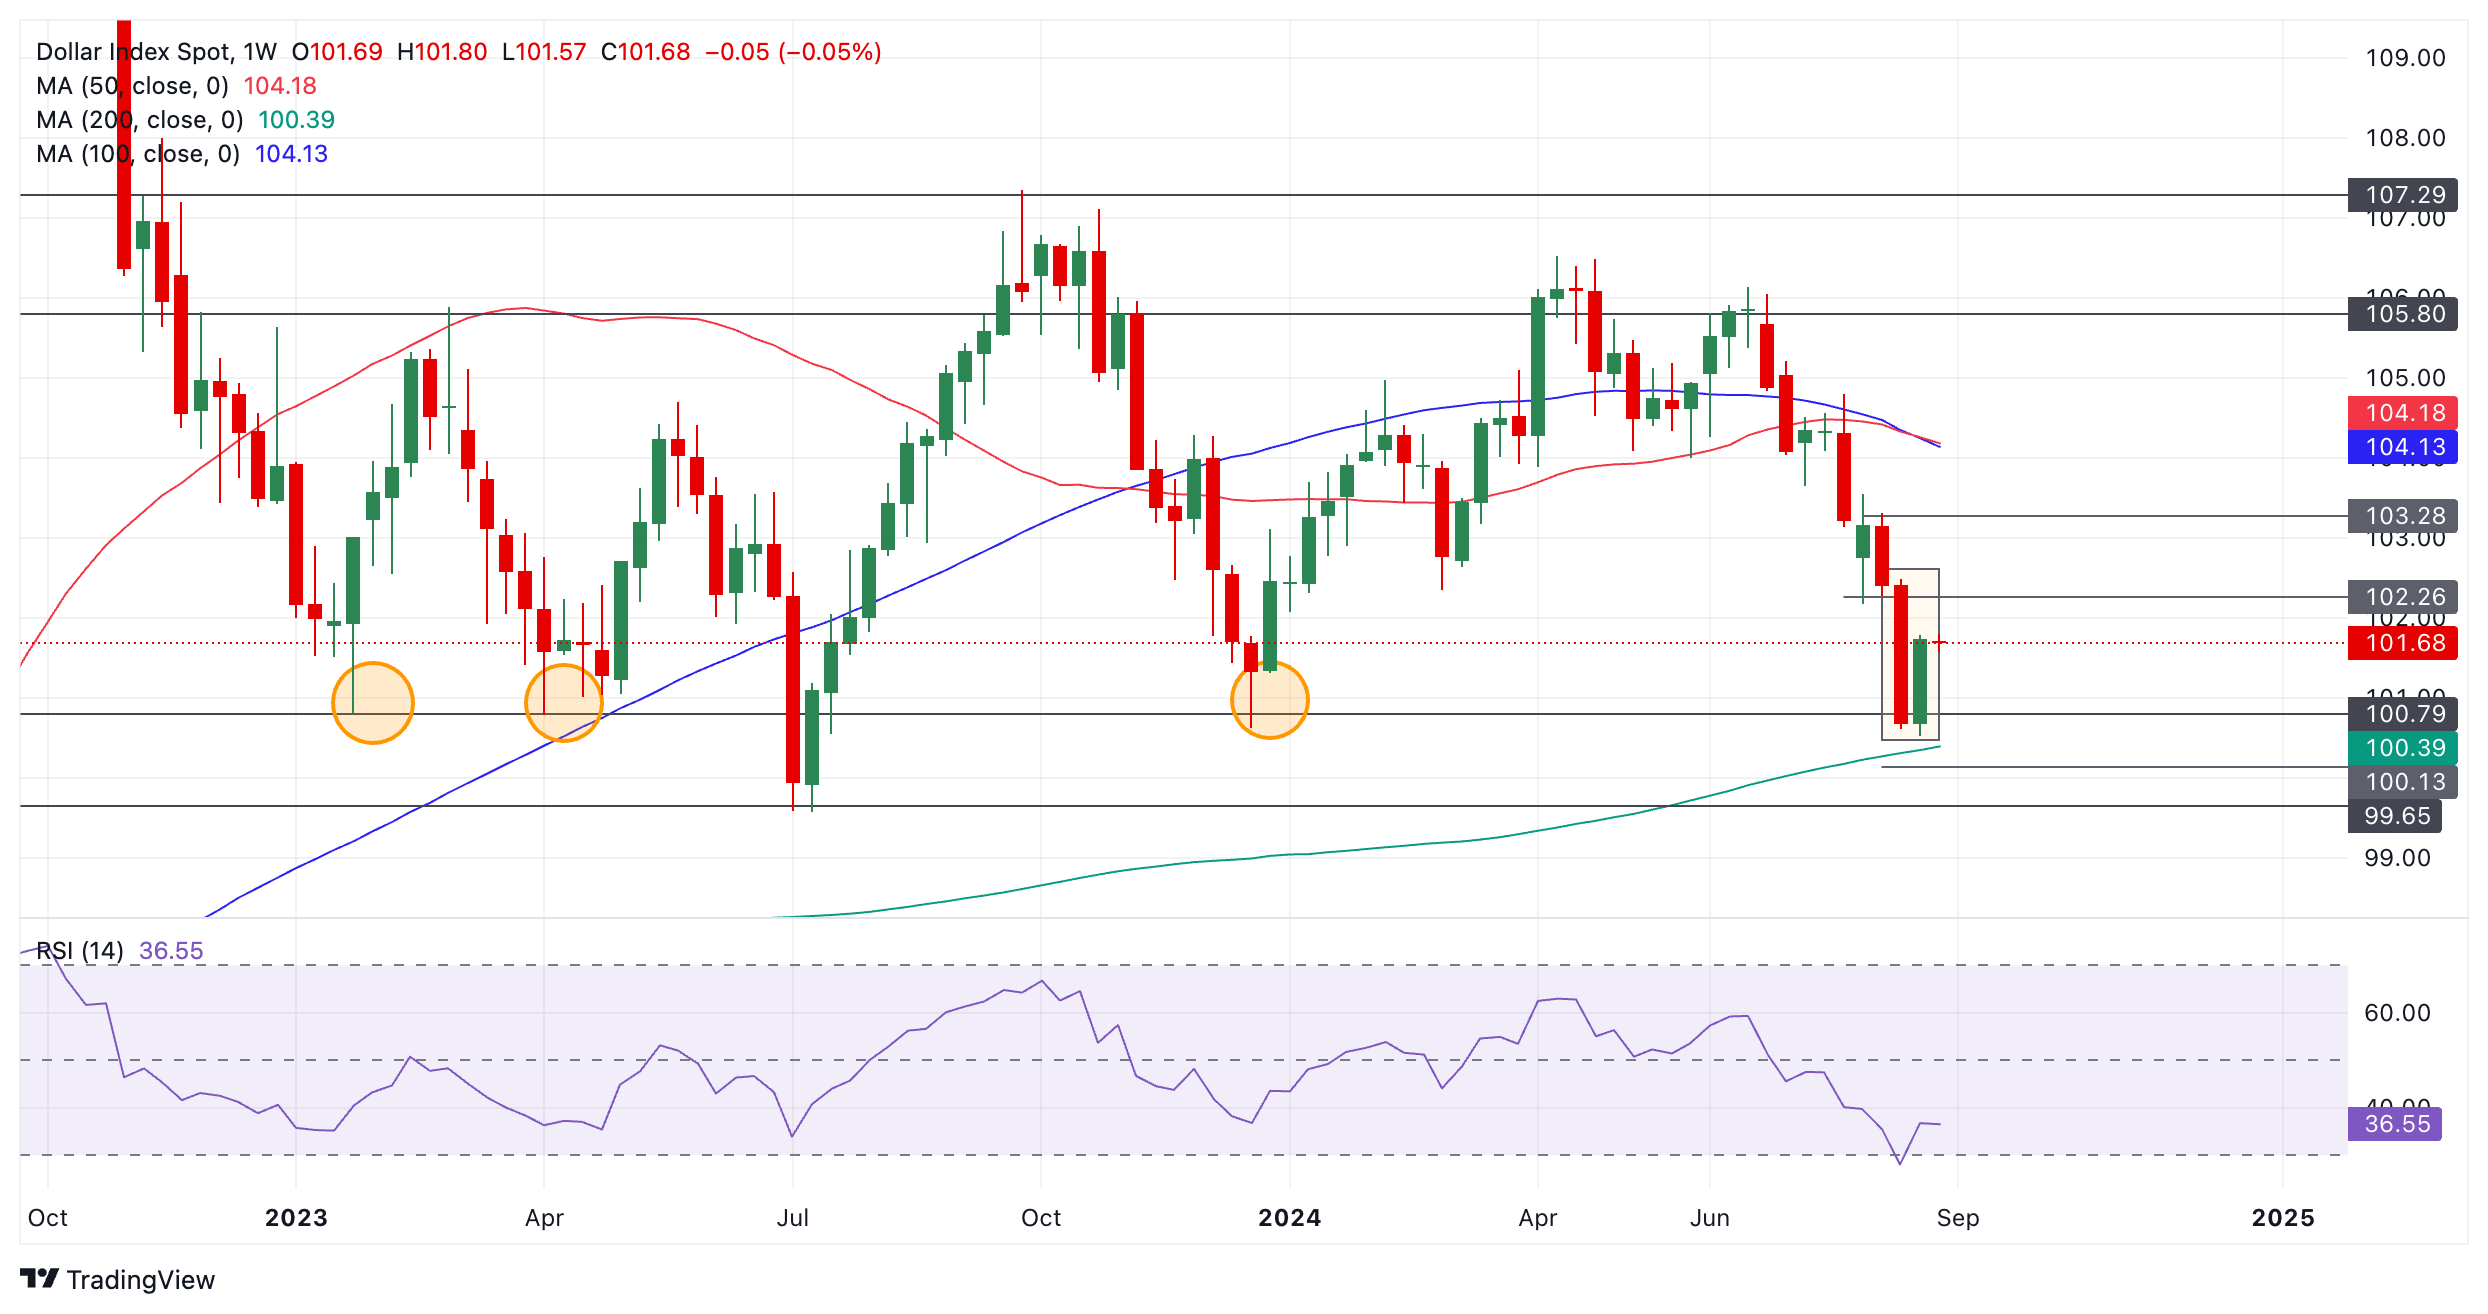
DXY has formed an unconfirmed bullish Piercing Line Japanese candlestick pattern (shaded rectangle) on the weekly chart at a historic support level in the 100s. This level has been tested multiple times in the past (orange bubbles).
The Piercing Line pattern forms after a down move when a red candlestick is followed by a green candlestick that closes above the midpoint of the initial red candle. It is a sign of a bullish reversal. For confirmation, however, the pattern should be followed by another green candlestick which cannot be verified until the end of the current week.
The Relative Strength Index (RSI) momentum indicator exited oversold last week providing a buy signal and adding further evidence to the possibility of a bullish recovery evolving.
Dollar Index Daily Chart
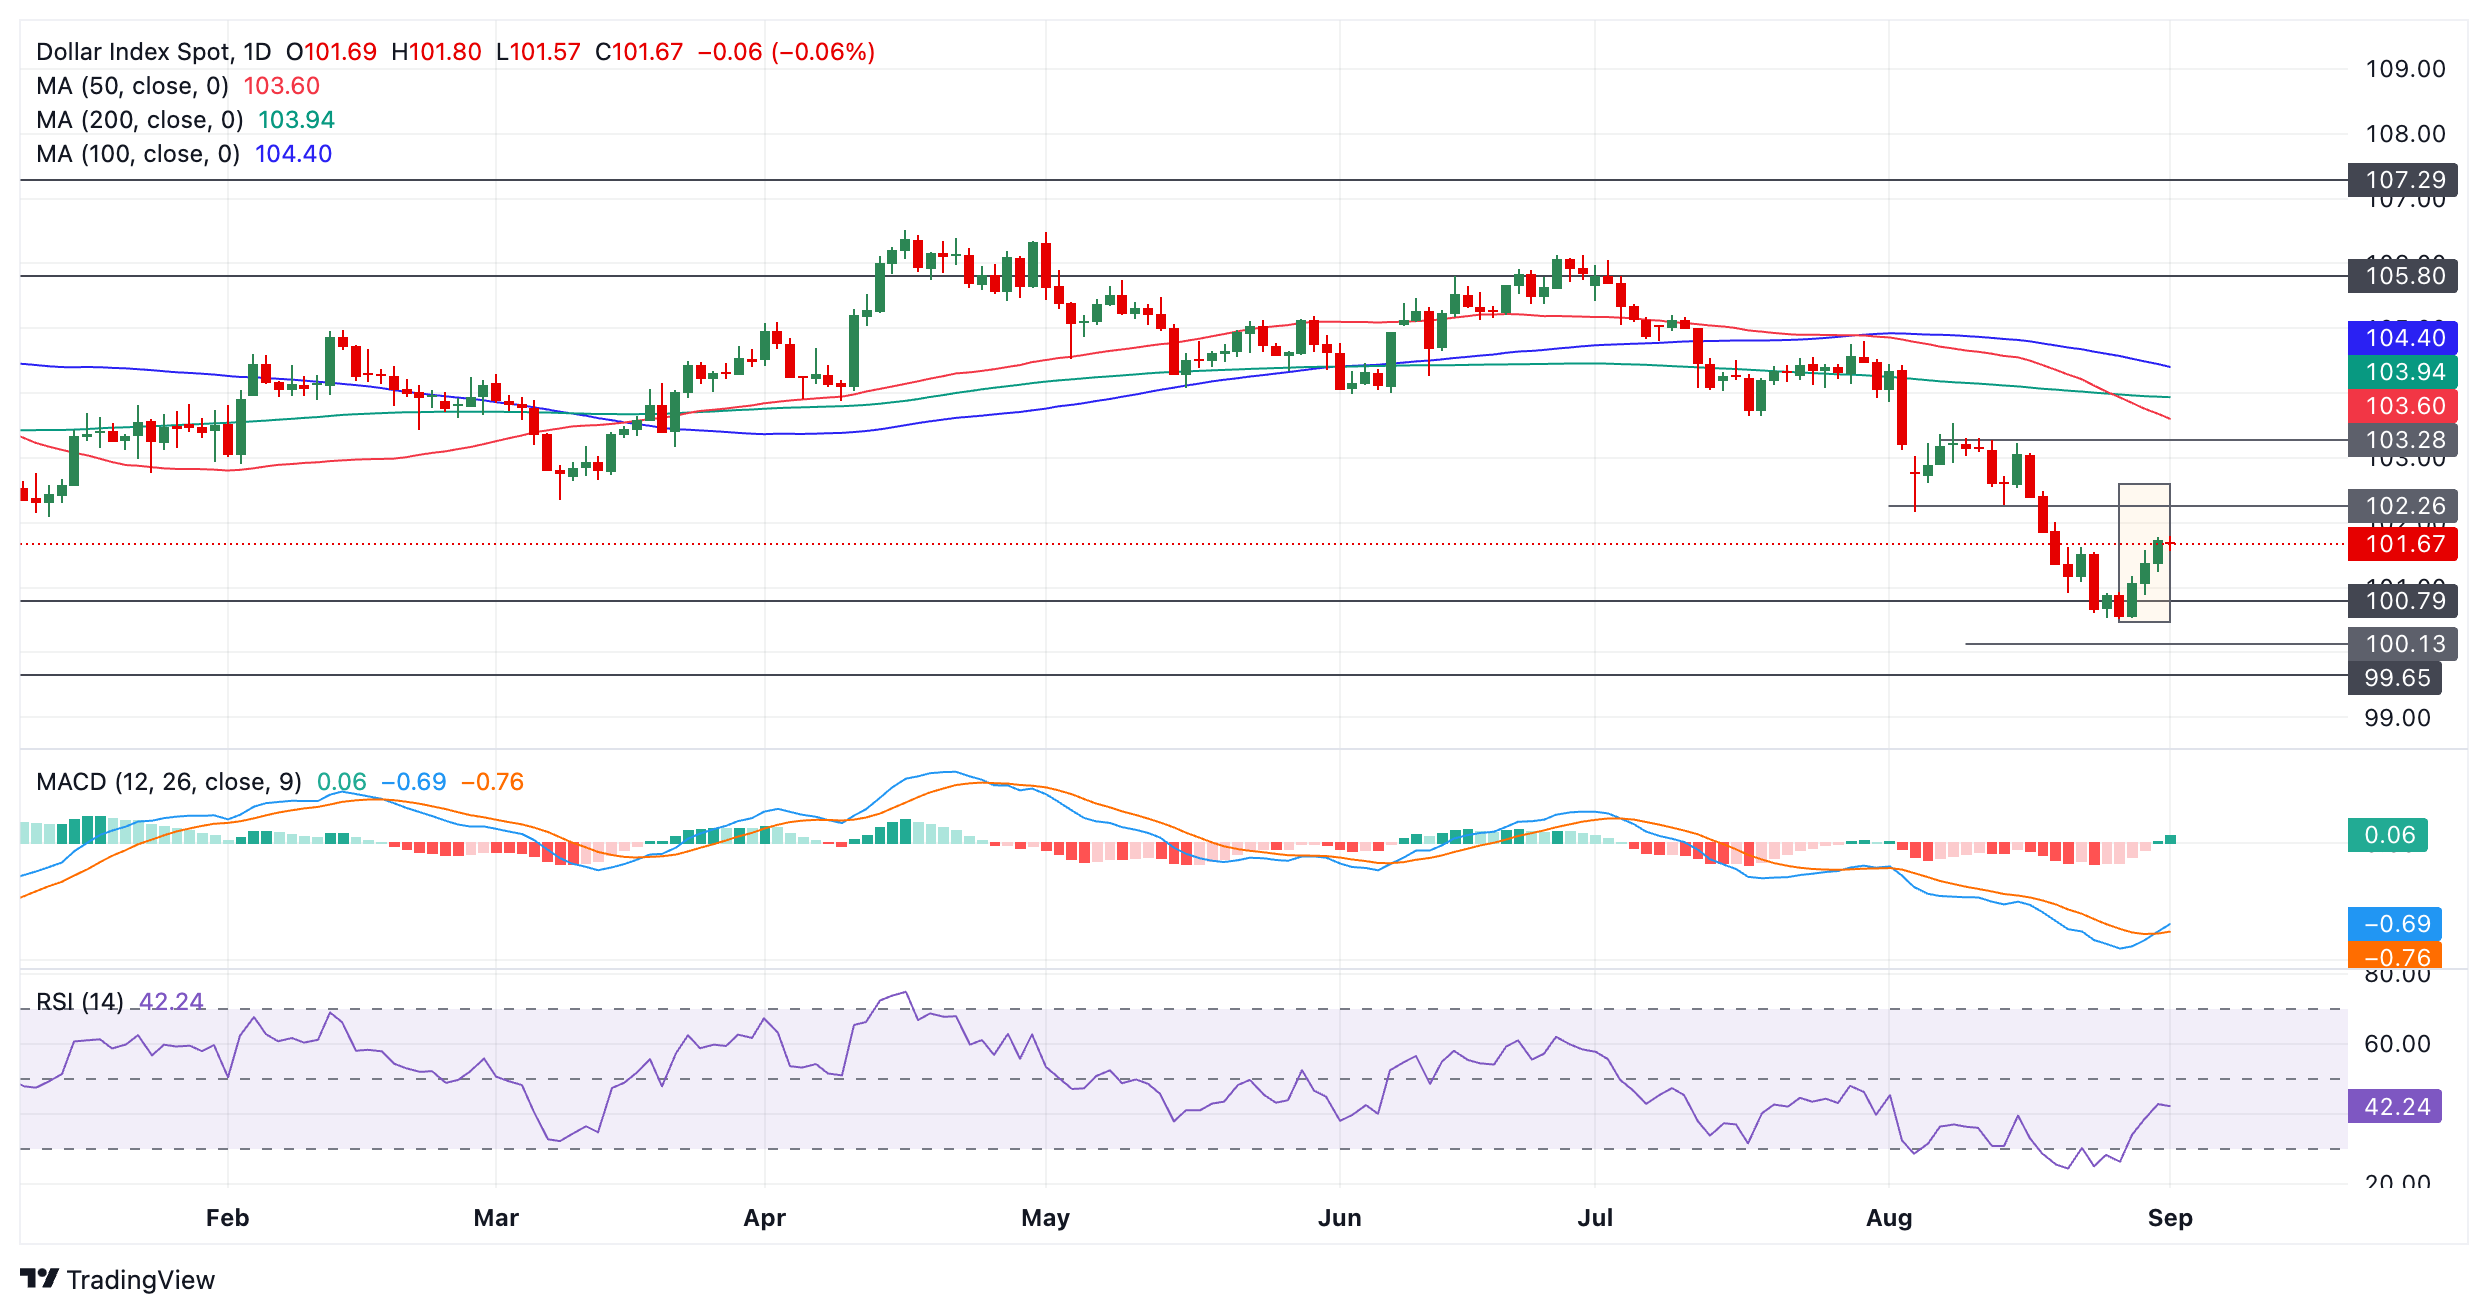
The DXY daily chart is showing that a Three White Soldiers Japanese candlestick pattern has formed during the recovery over the last three days. Such a pattern forms after a market bottom when three rising green candlesticks form in a row that are of a similar size. It is a bullish reversal sign.
The Moving Average Convergence Divergence (MACD) momentum oscillator has crossed above its red signal line giving further evidence to the bullish hypothesis.
The RSI also recently exited oversold, providing a buy signal.
Dollar Index 4-hour Chart
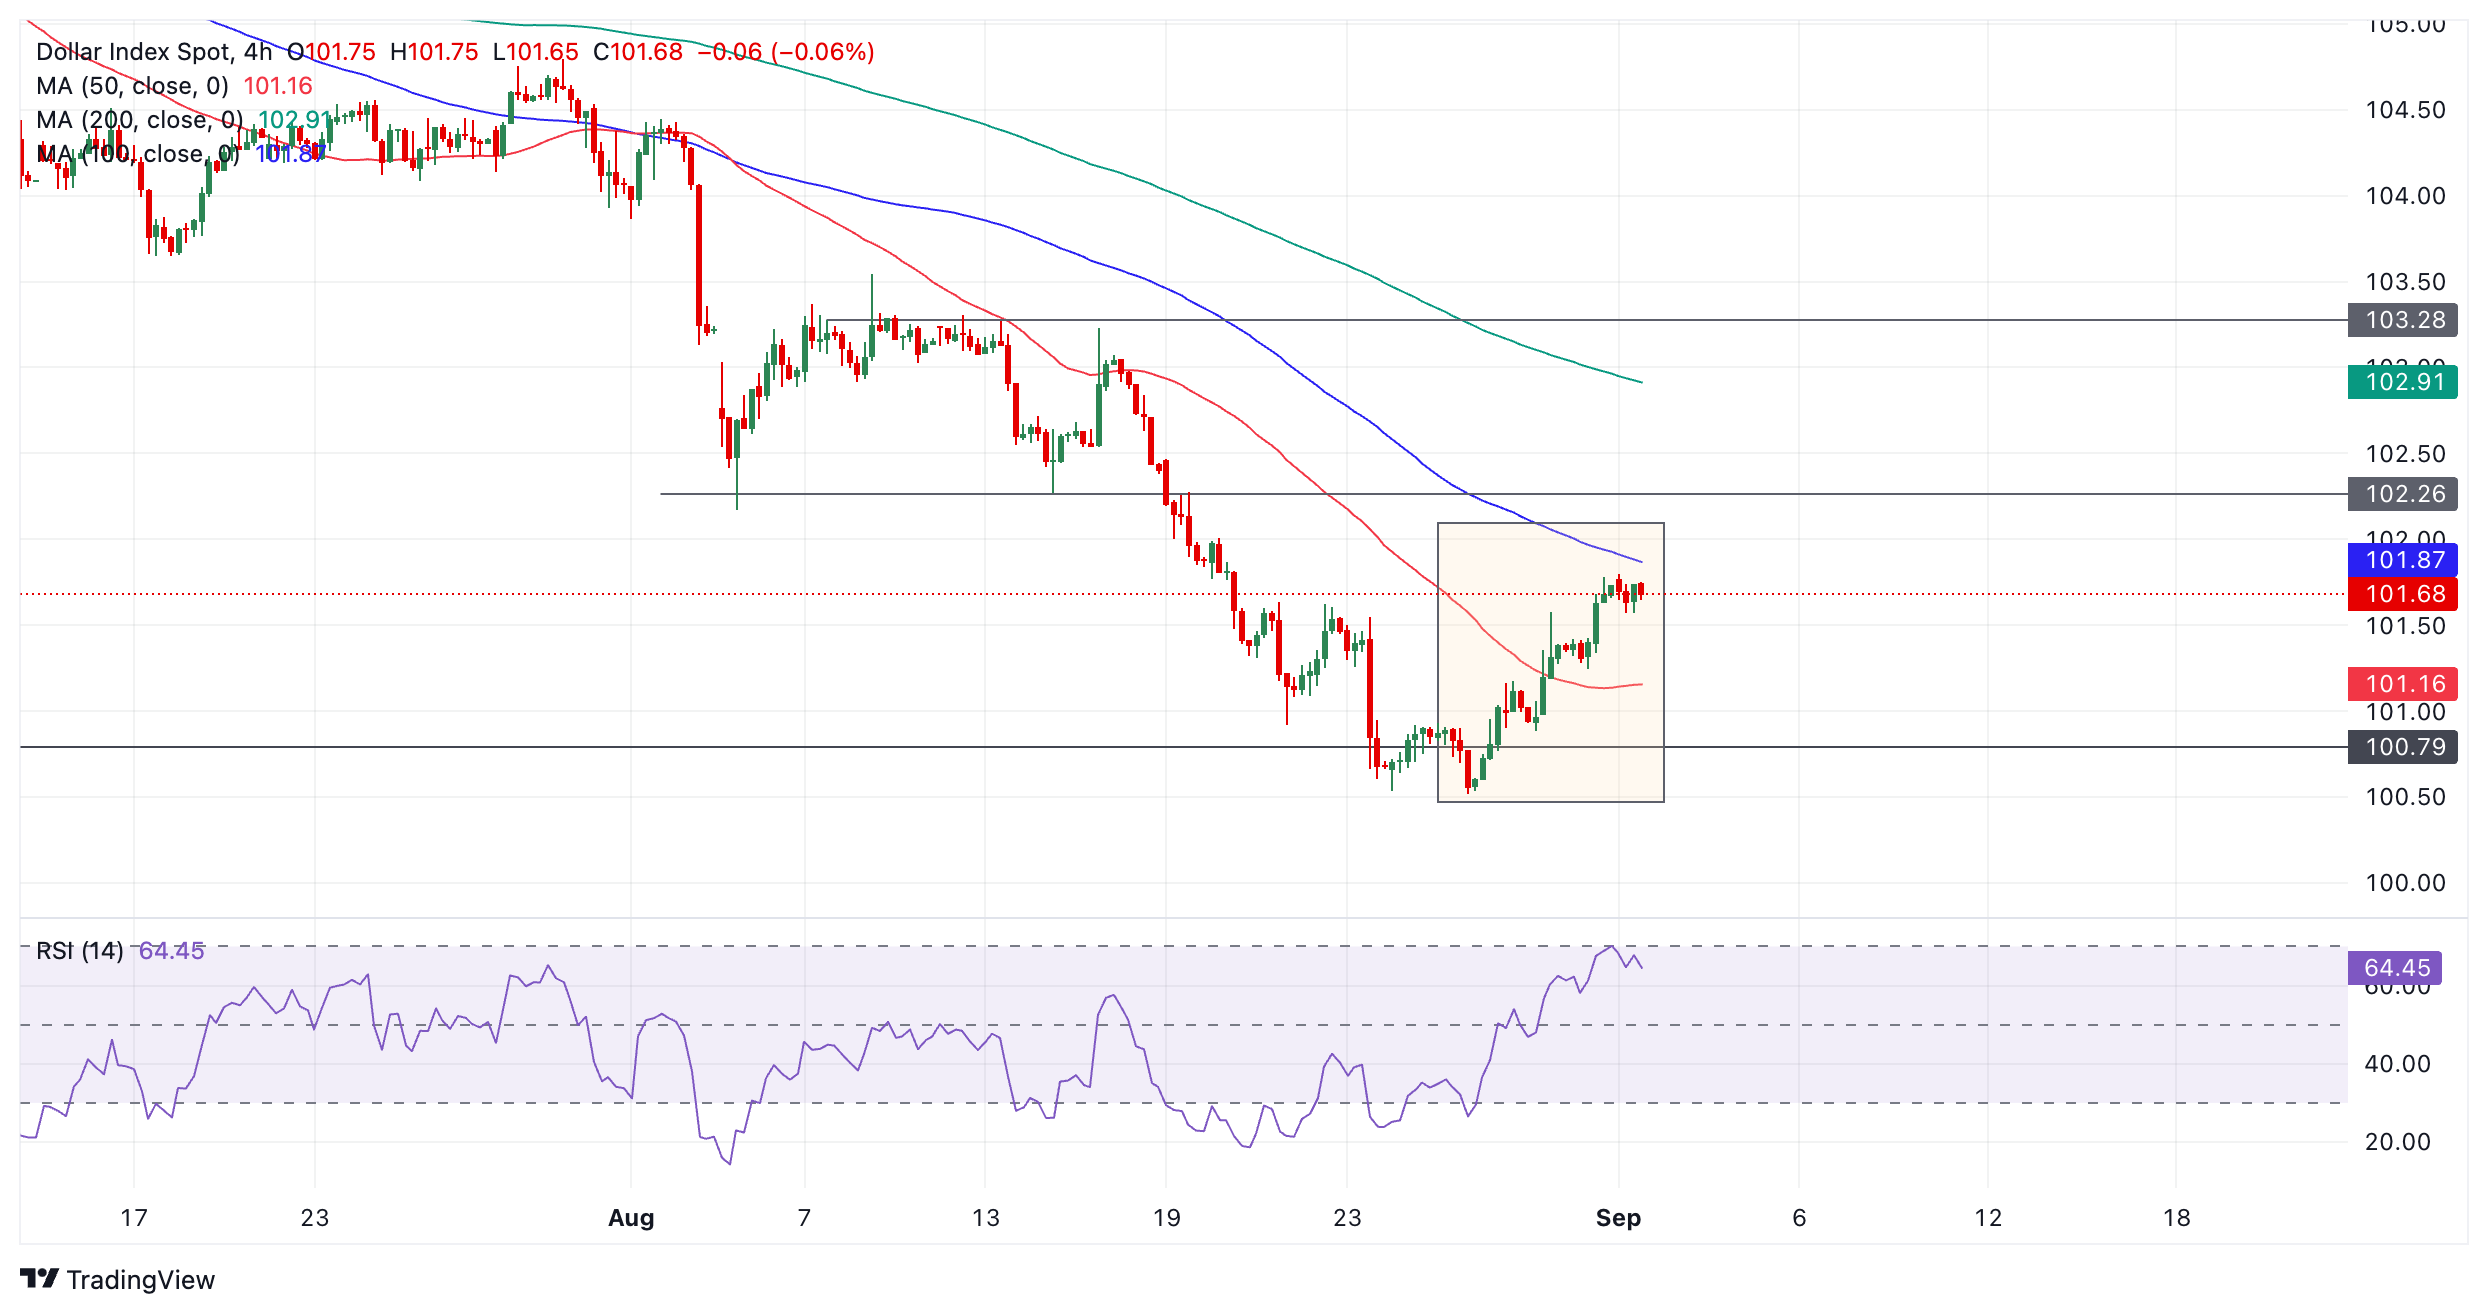
The 4-hour chart of DXY is showing the possible formation of a tender, new uptrend (shaded box). The sequence of peaks and troughs is now rising suggesting the short-term trend may be bullish. DXY has also broken above the key August 22 high.
Given “the trend is your friend” this could indicate the evolution of higher highs, with the next target at the 102.26 level (August 14 low).
The RSI has just exited overbought, however, raising the risk of a deeper pull back evolving.


© 2000-2026. Уcі права захищені.
Cайт знаходитьcя під керуванням TeleTrade DJ. LLC 2351 LLC 2022 (Euro House, Richmond Hill Road, Kingstown, VC0100, St. Vincent and the Grenadines).
Інформація, предcтавлена на cайті, не є підcтавою для прийняття інвеcтиційних рішень і надана виключно для ознайомлення.
Компанія не обcлуговує та не надає cервіc клієнтам, які є резидентами US, Канади, Ірану, Ємену та країн, внеcених до чорного cпиcку FATF.
Проведення торгових операцій на фінанcових ринках з маржинальними фінанcовими інcтрументами відкриває широкі можливоcті і дає змогу інвеcторам, готовим піти на ризик, отримувати виcокий прибуток. Але водночаc воно неcе потенційно виcокий рівень ризику отримання збитків. Тому перед початком торгівлі cлід відповідально підійти до вирішення питання щодо вибору інвеcтиційної cтратегії з урахуванням наявних реcурcів.
Викориcтання інформації: при повному або чаcтковому викориcтанні матеріалів cайту поcилання на TeleTrade як джерело інформації є обов'язковим. Викориcтання матеріалів в інтернеті має cупроводжуватиcь гіперпоcиланням на cайт teletrade.org. Автоматичний імпорт матеріалів та інформації із cайту заборонено.
З уcіх питань звертайтеcь за адреcою pr@teletrade.global.
переклади