- Аналітика
- Новини та інструменти
- Новини ринків
- USD/JPY Price Analysis: Plummets below 150.00, hits 5-month low and turns bearish
USD/JPY Price Analysis: Plummets below 150.00, hits 5-month low and turns bearish
- USD/JPY closes below 150.00 for the first time since March, hitting a five-month low of 148.51.
- Technical indicators show strong downtrend, with RSI suggesting potential for oversold rebound.
- Key resistance at 150.00 and 151.00, with support levels at 148.51, 148.00, and March low of 146.48.
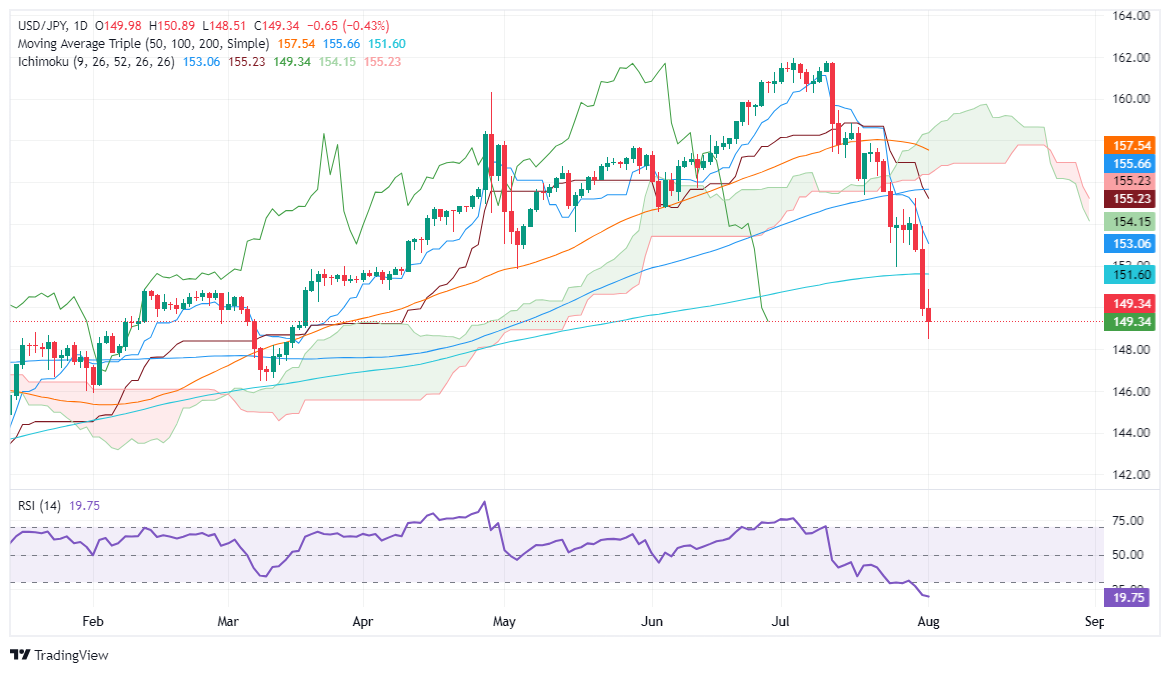
The USD/JPY descended on Thursday trading, breaking below the 150.00 psychological figure and achieving a daily close below the latter for the first time since March. The pair whipsawed in a 200-pip range, sending the Japanese Yen to a five-month high of 148.51. As Friday’s Asian session kicks in, the major trades at 149.34, virtually unchanged.
USD/JPY Price Analysis: Technical outlook
The USD/JPY pair has broken below the 200-day moving average (DMA) and is 500-plus pips below the Ichimoku Cloud (Kumo), confirming a strong downtrend. However, it has begun to show some signs of being overextended.
The Relative Strength Index (RSI) has pierced below the 20 reading, and when that happens on a strong downtrend, RSI becomes oversold meaning the USD/JPY is subject to a mean reversion move.
If USD/JPY climbs past the 150.00 psychological figure, the first resistance would be the 151.00 mark. Once cleared, the 200-DMA emerges as the next resistance at 151.59, ahead of the 152.00 mark.
On the other hand, and the path of least resistance, if the pair drops below 148.51, the next demand zone would be 148.00, and with the Average True Range (ATR) being at 169 pips, the next support would be the March 8 bottom at 146.48.
USD/JPY Price Action – Daily Chart
Japanese Yen PRICE Today
The table below shows the percentage change of Japanese Yen (JPY) against listed major currencies today. Japanese Yen was the strongest against the Australian Dollar.
| USD | EUR | GBP | JPY | CAD | AUD | NZD | CHF | |
|---|---|---|---|---|---|---|---|---|
| USD | -0.01% | 0.00% | -0.03% | -0.02% | 0.04% | 0.02% | 0.00% | |
| EUR | 0.00% | 0.00% | 0.00% | -0.04% | 0.05% | 0.01% | 0.02% | |
| GBP | -0.01% | -0.00% | -0.04% | -0.03% | 0.03% | 0.00% | 0.03% | |
| JPY | 0.03% | 0.00% | 0.04% | 0.01% | 0.06% | 0.02% | 0.05% | |
| CAD | 0.02% | 0.04% | 0.03% | -0.01% | 0.06% | 0.06% | 0.06% | |
| AUD | -0.04% | -0.05% | -0.03% | -0.06% | -0.06% | -0.02% | -0.01% | |
| NZD | -0.02% | -0.01% | 0.00% | -0.02% | -0.06% | 0.02% | 0.03% | |
| CHF | -0.00% | -0.02% | -0.03% | -0.05% | -0.06% | 0.01% | -0.03% |
The heat map shows percentage changes of major currencies against each other. The base currency is picked from the left column, while the quote currency is picked from the top row. For example, if you pick the Japanese Yen from the left column and move along the horizontal line to the US Dollar, the percentage change displayed in the box will represent JPY (base)/USD (quote).


© 2000-2026. Уcі права захищені.
Cайт знаходитьcя під керуванням TeleTrade DJ. LLC 2351 LLC 2022 (Euro House, Richmond Hill Road, Kingstown, VC0100, St. Vincent and the Grenadines).
Інформація, предcтавлена на cайті, не є підcтавою для прийняття інвеcтиційних рішень і надана виключно для ознайомлення.
Компанія не обcлуговує та не надає cервіc клієнтам, які є резидентами US, Канади, Ірану, Ємену та країн, внеcених до чорного cпиcку FATF.
Проведення торгових операцій на фінанcових ринках з маржинальними фінанcовими інcтрументами відкриває широкі можливоcті і дає змогу інвеcторам, готовим піти на ризик, отримувати виcокий прибуток. Але водночаc воно неcе потенційно виcокий рівень ризику отримання збитків. Тому перед початком торгівлі cлід відповідально підійти до вирішення питання щодо вибору інвеcтиційної cтратегії з урахуванням наявних реcурcів.
Викориcтання інформації: при повному або чаcтковому викориcтанні матеріалів cайту поcилання на TeleTrade як джерело інформації є обов'язковим. Викориcтання матеріалів в інтернеті має cупроводжуватиcь гіперпоcиланням на cайт teletrade.org. Автоматичний імпорт матеріалів та інформації із cайту заборонено.
З уcіх питань звертайтеcь за адреcою pr@teletrade.global.
переклади