- Аналітика
- Новини та інструменти
- Новини ринків
- Australian Dollar extends its losses after mixed PMI data
Australian Dollar extends its losses after mixed PMI data
- The Australian Dollar continues to lose ground following the release of PMI data on Wednesday.
- Australia's PMI improved to 47.4 in July from 47.2 in June; Services PMI dropped to 50.8 from 51.2.
- The US Dollar may be under pressure due to rising bets on a Fed rate cut in September.
The Australian Dollar (AUD) continues its losing streak for the eighth consecutive day following the release of mixed data from Australia's Judo Bank Purchasing Managers Index (PMI) on Wednesday. Moreover, sluggish economic activity in China has put additional selling pressure on the AUD. Concerns about the weak Chinese economy were heightened by an unexpected rate cut from the People's Bank of China (PBoC) on Monday.
Additionally, the weak outlook for the Chinese economy has caused a decline in iron ore prices, further pressuring the Australian Dollar. Iron ore prices depreciate toward $108.00, hitting its lowest level in three weeks. This decline is particularly impactful for Australia, the largest exporter of this precious metal.
The US Dollar (USD) may struggle due to rising bets on a Federal Reserve (Fed) rate cut in September, which could limit the downside of the AUD/USD pair. Traders await the data release of the Global Purchasing Managers Index (PMI) on Wednesday to gain fresh insights into the economic conditions of the United States (US).
According to CME Group’s FedWatch Tool, markets now indicate a 93.6% probability of a 25-basis point rate cut at the September Fed meeting, up from 88.5% a day earlier.
Daily Digest Market Movers: Australian Dollar depreciates due to China’s growing concerns
- Australia's Judo Bank Manufacturing PMI improved to 47.4 in July from 47.2 in June. Meanwhile, the Services PMI dropped to 50.8 in July from 51.2 in June. The Composite PMI also declined, falling to 50.2 in July from 50.7 in June.
- Media reports say that Vice President Kamala Harris has just passed 1,976 Democratic delegates to secure the party's presidential nomination. Harris is now the Democratic Party’s Presumptive Nominee for November’s Presidential Election.
- "The interest rate cuts by the People's Bank of China (PBoC) and the outcomes of the Third Plenum are too modest to convince market participants that a significant acceleration in the Chinese economy is in prospect," said Joseph Capurso, head of international economics at the Commonwealth Bank of Australia.
- The People’s Bank of China (PBoC) has cut one- and five-year loan prime rates by ten basis points to 3.35% and 3.85%, respectively. Any change in the Chinese economy could impact the Australian markets as both countries are close trade partners.
- Federal Reserve Bank of New York President John Williams stated on Friday that the long-term trends that caused declines in neutral interest rates before the pandemic continue to prevail. Williams noted, "My own Holston-Laubach-Williams estimates for r-star in the United States, Canada, and the Euro area are about the same level as they were before the pandemic," according to Bloomberg.
- Reuters cited Sean Langcake, head of macroeconomic forecasting for Oxford Economics Australia, saying, "The current pace of employment growth suggests demand is resilient and cost pressures will remain. We think the RBA will stay the course and keep rates on hold, but August is certainly a live meeting."
- Fed Chair Powell stated last week that the three US inflation readings from this year "add somewhat to confidence" that inflation is on track to meet the Fed’s target sustainably, suggesting that a shift to interest rate cuts may be imminent.
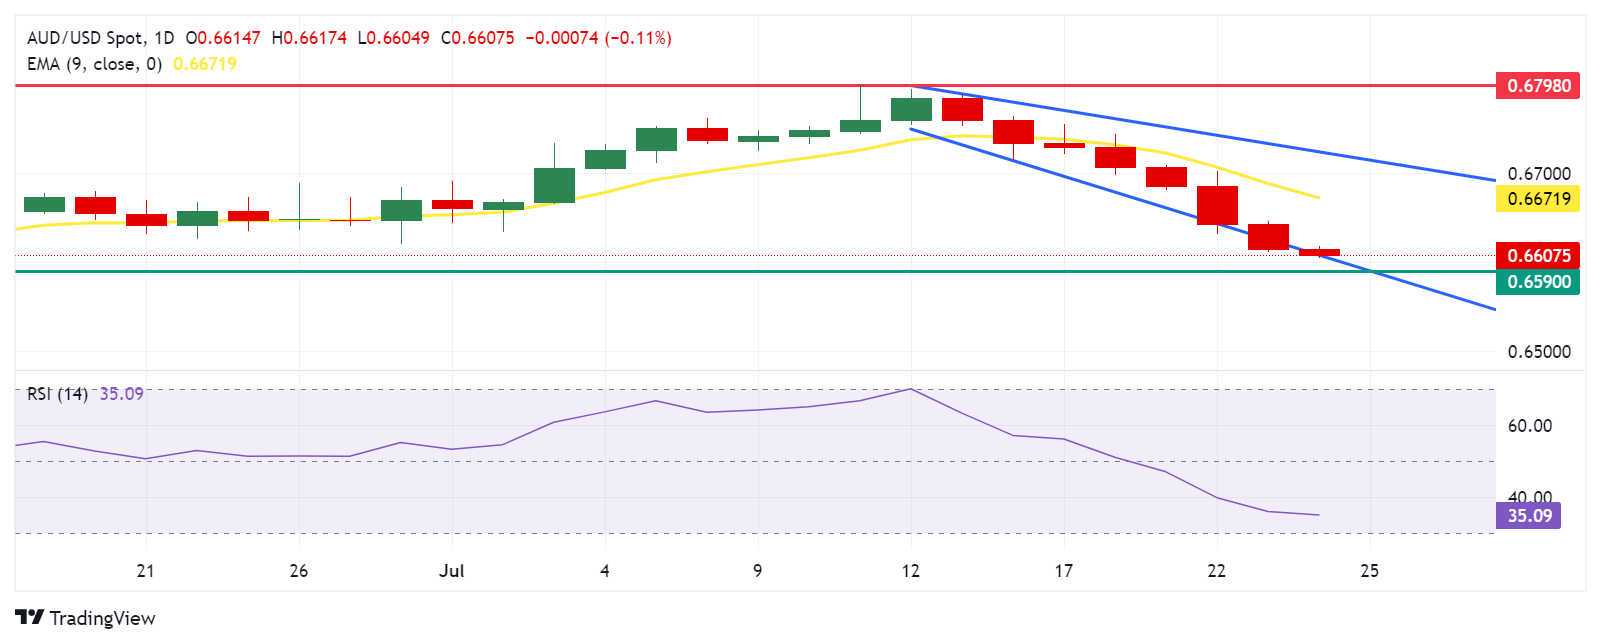
Technical Analysis: Australian Dollar falls to near 0.6600
The Australian Dollar trades around 0.6610 on Wednesday. The daily chart analysis shows that the AUD/USD pair is depreciating within a descending channel, indicating a bearish bias. The 14-day Relative Strength Index (RSI) is below the level of 50, confirming a bearish trend.
The AUD/USD pair tests the lower boundary of the descending channel near the psychological level of 0.6600. A decline below this level could push the pair toward the throwback support around 0.6590.
On the upside, key resistance is at the nine-day Exponential Moving Average (EMA) at 0.6671, followed by the psychological level of 0.6700. A breakthrough above this level could lead the AUD/USD pair to test the upper boundary of the descending channel around 0.6722, and then aim for a six-month high of 0.6798.
AUD/USD: Daily Chart
Australian Dollar PRICE Today
The table below shows the percentage change of Australian Dollar (AUD) against listed major currencies today. Australian Dollar was the weakest against the Japanese Yen.
| USD | EUR | GBP | JPY | CAD | AUD | NZD | CHF | |
|---|---|---|---|---|---|---|---|---|
| USD | 0.09% | 0.13% | -0.08% | 0.02% | 0.16% | 0.38% | 0.09% | |
| EUR | -0.09% | 0.03% | -0.19% | -0.07% | 0.08% | 0.28% | -0.01% | |
| GBP | -0.13% | -0.03% | -0.20% | -0.10% | 0.04% | 0.25% | -0.05% | |
| JPY | 0.08% | 0.19% | 0.20% | 0.13% | 0.26% | 0.45% | 0.17% | |
| CAD | -0.02% | 0.07% | 0.10% | -0.13% | 0.14% | 0.36% | 0.05% | |
| AUD | -0.16% | -0.08% | -0.04% | -0.26% | -0.14% | 0.21% | -0.08% | |
| NZD | -0.38% | -0.28% | -0.25% | -0.45% | -0.36% | -0.21% | -0.30% | |
| CHF | -0.09% | 0.00% | 0.05% | -0.17% | -0.05% | 0.08% | 0.30% |
The heat map shows percentage changes of major currencies against each other. The base currency is picked from the left column, while the quote currency is picked from the top row. For example, if you pick the Australian Dollar from the left column and move along the horizontal line to the US Dollar, the percentage change displayed in the box will represent AUD (base)/USD (quote).
Economic Indicator
Judo Bank Composite PMI
The Composite Purchasing Managers Index (PMI), released on a monthly basis by Judo Bank and S&P Global, is a leading indicator gauging private-business activity in Australia for both the manufacturing and services sectors. The data is derived from surveys to senior executives. Each response is weighted according to the size of the company and its contribution to total manufacturing or services output accounted for by the sub-sector to which that company belongs. Survey responses reflect the change, if any, in the current month compared to the previous month and can anticipate changing trends in official data series such as Gross Domestic Product (GDP), industrial production, employment and inflation. The index varies between 0 and 100, with levels of 50.0 signaling no change over the previous month. A reading above 50 indicates that the Australian private economy is generally expanding, a bullish sign for the Australian Dollar (AUD). Meanwhile, a reading below 50 signals that activity is generally declining, which is seen as bearish for AUD.
Read more.Last release: Tue Jul 23, 2024 23:00 (Prel)
Frequency: Monthly
Actual: 50.2
Consensus: -
Previous: 50.7
Source: S&P Global


© 2000-2026. Уcі права захищені.
Cайт знаходитьcя під керуванням TeleTrade DJ. LLC 2351 LLC 2022 (Euro House, Richmond Hill Road, Kingstown, VC0100, St. Vincent and the Grenadines).
Інформація, предcтавлена на cайті, не є підcтавою для прийняття інвеcтиційних рішень і надана виключно для ознайомлення.
Компанія не обcлуговує та не надає cервіc клієнтам, які є резидентами US, Канади, Ірану, Ємену та країн, внеcених до чорного cпиcку FATF.
Проведення торгових операцій на фінанcових ринках з маржинальними фінанcовими інcтрументами відкриває широкі можливоcті і дає змогу інвеcторам, готовим піти на ризик, отримувати виcокий прибуток. Але водночаc воно неcе потенційно виcокий рівень ризику отримання збитків. Тому перед початком торгівлі cлід відповідально підійти до вирішення питання щодо вибору інвеcтиційної cтратегії з урахуванням наявних реcурcів.
Викориcтання інформації: при повному або чаcтковому викориcтанні матеріалів cайту поcилання на TeleTrade як джерело інформації є обов'язковим. Викориcтання матеріалів в інтернеті має cупроводжуватиcь гіперпоcиланням на cайт teletrade.org. Автоматичний імпорт матеріалів та інформації із cайту заборонено.
З уcіх питань звертайтеcь за адреcою pr@teletrade.global.
переклади