- Аналітика
- Новини та інструменти
- Новини ринків
- USD/CHF Price Analysis: Probably in new short-term uptrend
USD/CHF Price Analysis: Probably in new short-term uptrend
- USD/CHF is now probably in a short-term uptrend, with odds favoring bullish bets.
- It has broken above the last lower high, a trendline and the 50 Simple Moving Average.
- The break above the key 0.8989 resistance level provided further confirmation.
USD/CHF is probably in a short-term uptrend after breaking above the key 0.8989 resistance level (June 11 high). The reversal in trend means the odds now favor more upside going forward.
USD/CHF 4-hour Chart
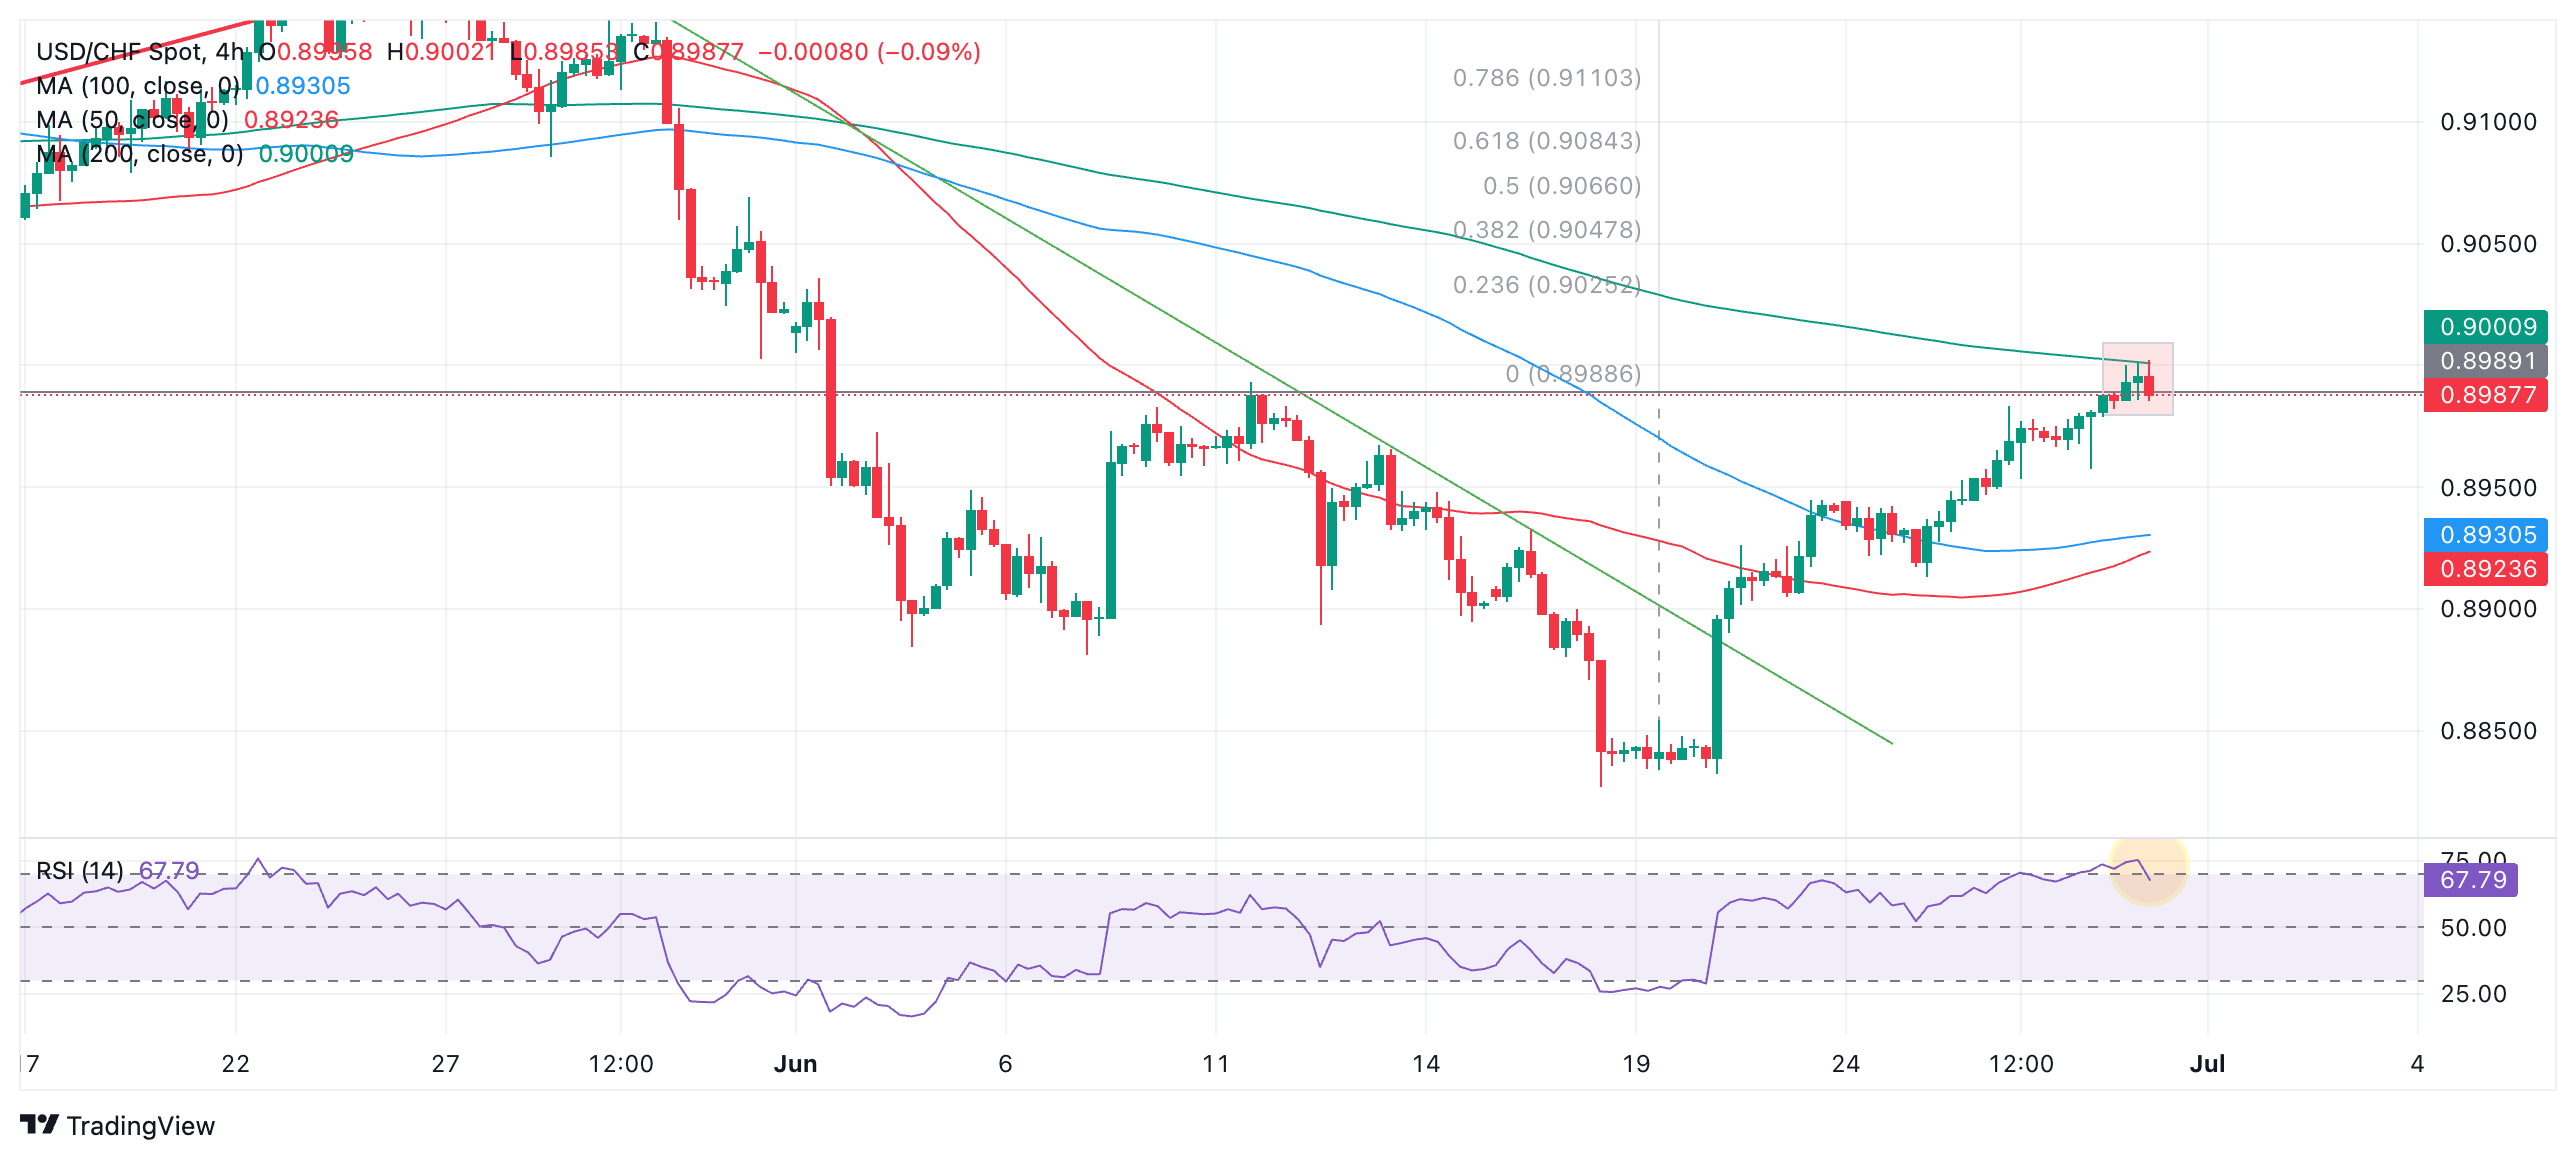
Upside targets for the pair lie at 0.9034 (50-day Simple Moving Average) followed by 0.9084, the 0.618 Fibonacci extension of the height of the bottoming pattern that evolved between June 11-27, and looks similar to a bullish Inverse Head and Shoulders (H&S) pattern. The distinctive square-shaped “head” that formed between June 18-20 is further evidence it might be an Inverse H&S.
A break on a closing basis clearly above 0.9000, and the green 200-period SMA would provide bullish confirmation of a continuation of the trend.
There are, however, signs a pullback may be evolving in the very near term. The Relative Strength Index (RSI) is overbought (shaded circle) and threatening to exit the overbought zone which would be a bearish sign. Whether or not it exits the overbought zone depends on how the current 4-hour bar closes. If it ends bullishly then the RSI will remain overbought; if bearishly it will exit overbought and suggest the beginning of a pullback.
Another sign a pullback may be developing is the Tweezer Top Japanese candlestick bearish reversal pattern (red shaded rectangle) that has formed over the past two candles. Tweezer tops occur at market tops when two bars both rise up to a similar high before closing back down near the middle of the candle. The pattern formed looks much like a "tweezer". It is a fairly reliable short-term reversal sign especially if followed by a bearish third candle. In this case the third candle is in the middle of completing so its not clear whether it will be red, however, it is at the time of writing.
A pullback, if it evolves, would be expected to fall to support at around the 0.8950s initially, from where it might turn around and begin rising again, in line with the dominant short-term uptrend.


© 2000-2026. Уcі права захищені.
Cайт знаходитьcя під керуванням TeleTrade DJ. LLC 2351 LLC 2022 (Euro House, Richmond Hill Road, Kingstown, VC0100, St. Vincent and the Grenadines).
Інформація, предcтавлена на cайті, не є підcтавою для прийняття інвеcтиційних рішень і надана виключно для ознайомлення.
Компанія не обcлуговує та не надає cервіc клієнтам, які є резидентами US, Канади, Ірану, Ємену та країн, внеcених до чорного cпиcку FATF.
Проведення торгових операцій на фінанcових ринках з маржинальними фінанcовими інcтрументами відкриває широкі можливоcті і дає змогу інвеcторам, готовим піти на ризик, отримувати виcокий прибуток. Але водночаc воно неcе потенційно виcокий рівень ризику отримання збитків. Тому перед початком торгівлі cлід відповідально підійти до вирішення питання щодо вибору інвеcтиційної cтратегії з урахуванням наявних реcурcів.
Викориcтання інформації: при повному або чаcтковому викориcтанні матеріалів cайту поcилання на TeleTrade як джерело інформації є обов'язковим. Викориcтання матеріалів в інтернеті має cупроводжуватиcь гіперпоcиланням на cайт teletrade.org. Автоматичний імпорт матеріалів та інформації із cайту заборонено.
З уcіх питань звертайтеcь за адреcою pr@teletrade.global.
переклади