- Аналітика
- Новини та інструменти
- Новини ринків
- NZD/JPY Price Analysis: Cross continues consolidating, still above 97.00
NZD/JPY Price Analysis: Cross continues consolidating, still above 97.00
- NZD/JPY remains stable at 97.60, as the pair starts consolidating.
- The 20-day SMA at 96.30 offers considerable support against a potential correction.
- Despite the consolidation phase, the bullish outlook persists, eyeing the next key resistance at 98.00.
On Tuesday, the NZD/JPY cross appeared to have entered a consolidation phase, retaining its footing at the fresh high of 97.80. Flaunting its resilience, the pair maintained its strong support at the 20-day Simple Moving Average (SMA) of 96.30, while hovering at high levels not witnessed since July 2007. The bullish outlook remains undisputed, despite the necessity for a healthy correction to address the overbought conditions.
The daily Relative Strength Index (RSI) currently stands at 66, a decline from Monday's 68, hinting at an impending downtrend. However, it remains within a positive territory devoid of extreme conditions. Meanwhile, the Moving Average Convergence Divergence (MACD) prints flat red bars which implies diminishing buying pressure as a shift towards a potential consolidation or correction phase.
NZD/JPY daily chart
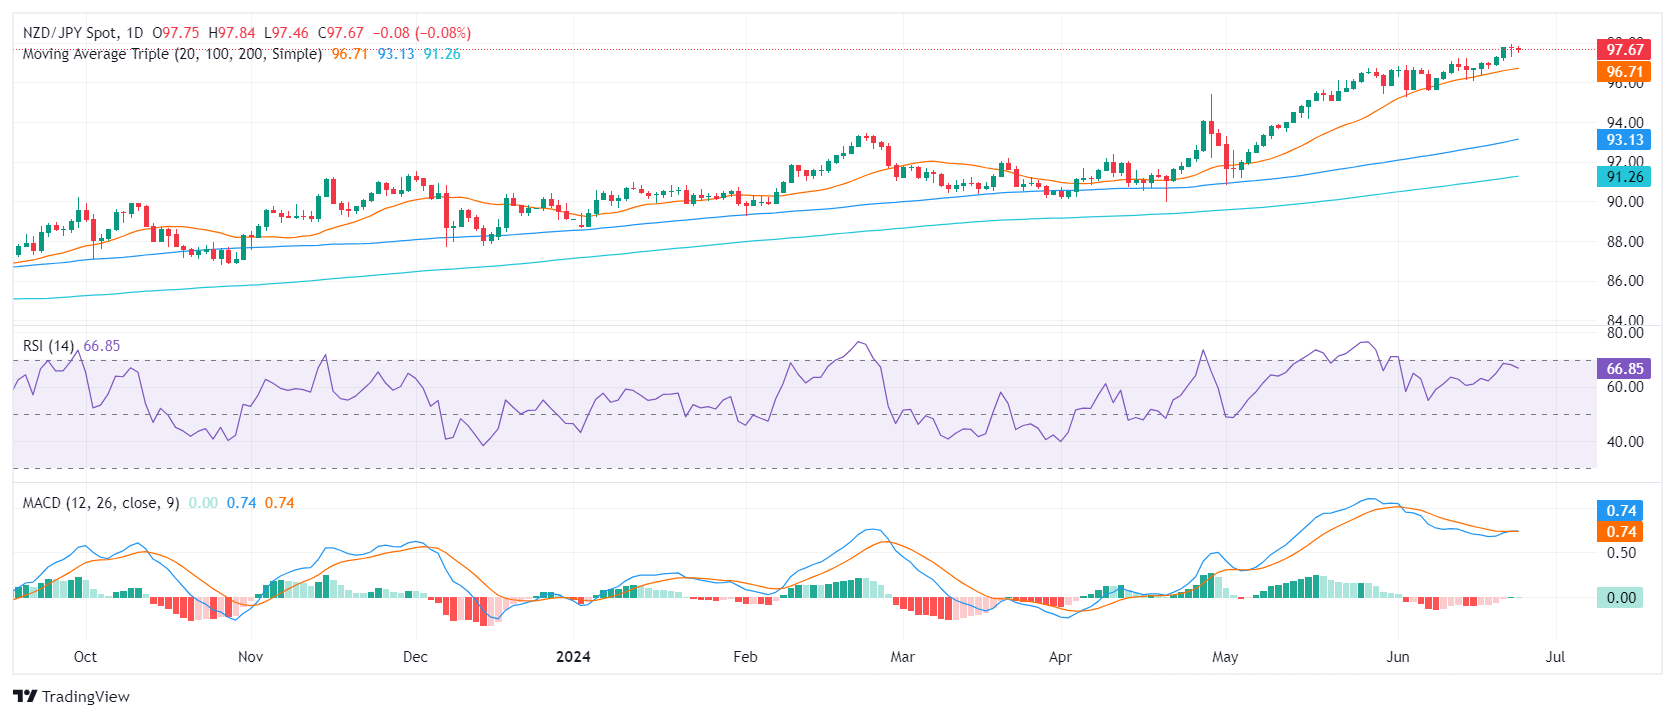
The steady grip of bulls above the 20-day SMA illustrates their strength, coupled with the technical indicators nearing overbought status, this further cements the positive technical outlook of the Kiwi against the Yen. However, overbought conditions necessitate a healthy correction or consolidation to ensure sustained upward momentum.
As investors anticipate subsequent trading sessions, the focus is on the immediate support at 97.00 and the resistance target at 98.00. A sustained break above the consolidation range could validate further upside while slipping below the 20-day SMA could indicate a deeper correction.


© 2000-2026. Уcі права захищені.
Cайт знаходитьcя під керуванням TeleTrade DJ. LLC 2351 LLC 2022 (Euro House, Richmond Hill Road, Kingstown, VC0100, St. Vincent and the Grenadines).
Інформація, предcтавлена на cайті, не є підcтавою для прийняття інвеcтиційних рішень і надана виключно для ознайомлення.
Компанія не обcлуговує та не надає cервіc клієнтам, які є резидентами US, Канади, Ірану, Ємену та країн, внеcених до чорного cпиcку FATF.
Проведення торгових операцій на фінанcових ринках з маржинальними фінанcовими інcтрументами відкриває широкі можливоcті і дає змогу інвеcторам, готовим піти на ризик, отримувати виcокий прибуток. Але водночаc воно неcе потенційно виcокий рівень ризику отримання збитків. Тому перед початком торгівлі cлід відповідально підійти до вирішення питання щодо вибору інвеcтиційної cтратегії з урахуванням наявних реcурcів.
Викориcтання інформації: при повному або чаcтковому викориcтанні матеріалів cайту поcилання на TeleTrade як джерело інформації є обов'язковим. Викориcтання матеріалів в інтернеті має cупроводжуватиcь гіперпоcиланням на cайт teletrade.org. Автоматичний імпорт матеріалів та інформації із cайту заборонено.
З уcіх питань звертайтеcь за адреcою pr@teletrade.global.
переклади