- Аналітика
- Новини та інструменти
- Новини ринків
- NZD/JPY Price Analysis: Cross extends gains to multi-year highs around 97.50
NZD/JPY Price Analysis: Cross extends gains to multi-year highs around 97.50
- Buyers successfully clear previous losses, stabilizing the cross at 97.80
- The 20-day SMA at 96.60 remains an important support, defending against sellers' attempts.
- Approaching overbought conditions suggests a potential correction, although the overall outlook remains positive.
On Monday, the NZD/JPY pair recorded a low of 97.28 before buyers stepped in and cleared all losses, stabilizing the cross at around 97.80. The potent performance fortified the bullish sentiment, with the pair glowing at highs not seen since July 2007, but in entered the Asian session on a neutral note. In the last sessions, the 20-day Simple Moving Average (SMA) at 96.60 has emerged as strong support, with sellers yet unable to breach this level, serving to further solidify the positive outlook.
The daily Relative Strength Index (RSI) currently reads 67, indicating higher momentum than Friday's reading and continues to suggest an upward trend. Meanwhile, the Moving Average Convergence Divergence (MACD) for Monday presents a fresh green bar, indicating increased buying pressure. However, investors are advised caution as the RSI nears the overbought threshold, hinting at the possibility of a near-term correction.
NZD/JPY daily chart
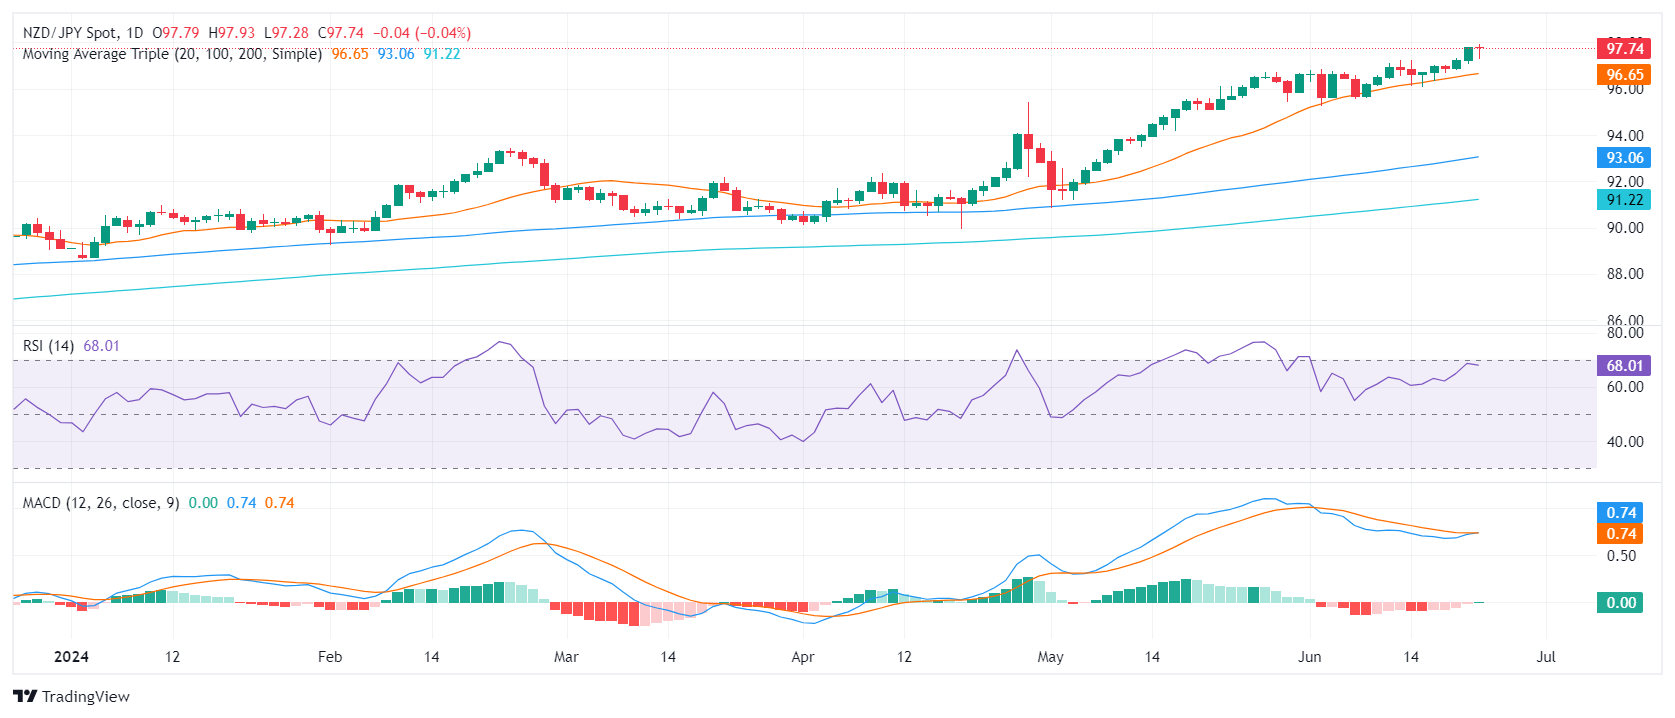
The bulls' resilience in maintaining positions above the 20-day SMA remains steadfast. This, combined with the approaching overbought daily technical indicators, further reinforces the positive technical outlook of the Kiwi against the Yen.
In subsequent trading sessions, the cross may fluctuate between the immediate support at 97.00 and the resistance target at 98.00. Investors should monitor these levels for a break above the consolidation range, indicating continued upward movement, or a breach below the 20-day SMA, which could signal a deeper correction. The 97.30 area also showed itself as a strong support.


© 2000-2026. Уcі права захищені.
Cайт знаходитьcя під керуванням TeleTrade DJ. LLC 2351 LLC 2022 (Euro House, Richmond Hill Road, Kingstown, VC0100, St. Vincent and the Grenadines).
Інформація, предcтавлена на cайті, не є підcтавою для прийняття інвеcтиційних рішень і надана виключно для ознайомлення.
Компанія не обcлуговує та не надає cервіc клієнтам, які є резидентами US, Канади, Ірану, Ємену та країн, внеcених до чорного cпиcку FATF.
Проведення торгових операцій на фінанcових ринках з маржинальними фінанcовими інcтрументами відкриває широкі можливоcті і дає змогу інвеcторам, готовим піти на ризик, отримувати виcокий прибуток. Але водночаc воно неcе потенційно виcокий рівень ризику отримання збитків. Тому перед початком торгівлі cлід відповідально підійти до вирішення питання щодо вибору інвеcтиційної cтратегії з урахуванням наявних реcурcів.
Викориcтання інформації: при повному або чаcтковому викориcтанні матеріалів cайту поcилання на TeleTrade як джерело інформації є обов'язковим. Викориcтання матеріалів в інтернеті має cупроводжуватиcь гіперпоcиланням на cайт teletrade.org. Автоматичний імпорт матеріалів та інформації із cайту заборонено.
З уcіх питань звертайтеcь за адреcою pr@teletrade.global.
переклади