- Аналітика
- Новини та інструменти
- Новини ринків
- EUR/JPY Price Analysis: Extends gains eye YTD high above 171.00
EUR/JPY Price Analysis: Extends gains eye YTD high above 171.00
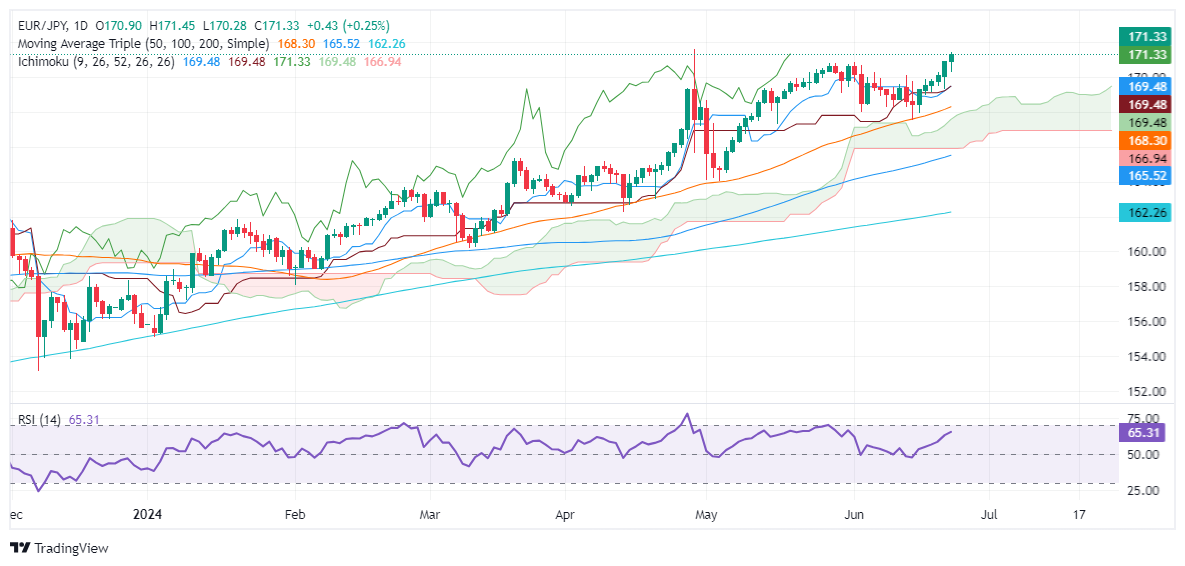
- EUR/JPY extends its gains for the sixth consecutive day and nearing the YTD high of 171.58.
- Technical outlook shows bullish momentum, with RSI indicating potential for further gains.
- Key resistance levels are YTD high at 171.58, 172.00, 172.50, and 173.00.
- Key support levels would be 171.00, the confluence of Tenkan, Kijun-Sen, and Senkou Span A at 169.48, and 50-DMA.
The EUR/JPY extended its gains for the sixth straight day on Monday and is up 0.24%. Yet it remains shy of testing the year-to-date (YTD) high reached on April 29 at 171.58. At the time of writing, the cross is trading at 171.29, above the 171.00 key technical level.
EUR/JPY Price Analysis: Technical outlook
The pair is set to extend its gains. Still, intervention fears that the Bank of Japan or the Minister of Finance might step into the FX markets loom, keeping investors on their toes.
Momentum suggests that the cross could extend its gains, as the Relative Strength Index (RSI) is bullish.
Therefore, the EUR/JPY first resistance would be the YTD high at 171.58. A breach of the latter will expose the 172.00 figure, followed by the 172.50 mark. Once those two levels are cleated, up next will be the 173.00 psychological level.
On further weakness, the EUR/JPY might be headed for a pullback, and test 171.00. Once cleared, the next support would be the confluence of the Tenkan, Kijun-Sen and Senkou Span A at 169.48. Once surpassed, the next stop would be the 50-day moving average (DMA) at 168.40.
EUR/JPY Price Action – Daily Chart


© 2000-2026. Уcі права захищені.
Cайт знаходитьcя під керуванням TeleTrade DJ. LLC 2351 LLC 2022 (Euro House, Richmond Hill Road, Kingstown, VC0100, St. Vincent and the Grenadines).
Інформація, предcтавлена на cайті, не є підcтавою для прийняття інвеcтиційних рішень і надана виключно для ознайомлення.
Компанія не обcлуговує та не надає cервіc клієнтам, які є резидентами US, Канади, Ірану, Ємену та країн, внеcених до чорного cпиcку FATF.
Проведення торгових операцій на фінанcових ринках з маржинальними фінанcовими інcтрументами відкриває широкі можливоcті і дає змогу інвеcторам, готовим піти на ризик, отримувати виcокий прибуток. Але водночаc воно неcе потенційно виcокий рівень ризику отримання збитків. Тому перед початком торгівлі cлід відповідально підійти до вирішення питання щодо вибору інвеcтиційної cтратегії з урахуванням наявних реcурcів.
Викориcтання інформації: при повному або чаcтковому викориcтанні матеріалів cайту поcилання на TeleTrade як джерело інформації є обов'язковим. Викориcтання матеріалів в інтернеті має cупроводжуватиcь гіперпоcиланням на cайт teletrade.org. Автоматичний імпорт матеріалів та інформації із cайту заборонено.
З уcіх питань звертайтеcь за адреcою pr@teletrade.global.
переклади