- Аналітика
- Новини та інструменти
- Новини ринків
- NZD/USD Price Analysis: Bulls struggle to hold gains, Kiwi outlook turns negative
NZD/USD Price Analysis: Bulls struggle to hold gains, Kiwi outlook turns negative
- Kiwi tallies a three-day losing streak, end the week on a negative note with the pair stabilizing at 0.6115.
- NZD/USD outlook continues to skew bearish as bulls fail to maintain upward traction.
- Bucking the bearish trend, a break above 0.6150, the position of the 20-day SMA, is vital.
On Friday, the NZD/USD extended its losing streak to three days. Despite an attempt to rally which took the pair to a high of 0.6140, the bulls were unable to return to the positive side and the pair stabilized at 0.6115 The unsuccessful attempt to maintain gains solidifies the increasing bearish sentiment for the Kiwi. The currency pair must climb past the 20-day Simple Moving Average (SMA) situated at 0.6150 to brighten the otherwise negative outlook.
The Relative Strength Index (RSI) for the NZD/USD pair on the daily chart locates at 49, hinting at a shift of momentum towards more bearishness. Despite this downward shift, the RSI remains near the neutral zone. Furthermore, the Moving Average Convergence Divergence (MACD) continues to increase its red bars, indicating an amplified seller presence in the market.
NZD/USD daily chart
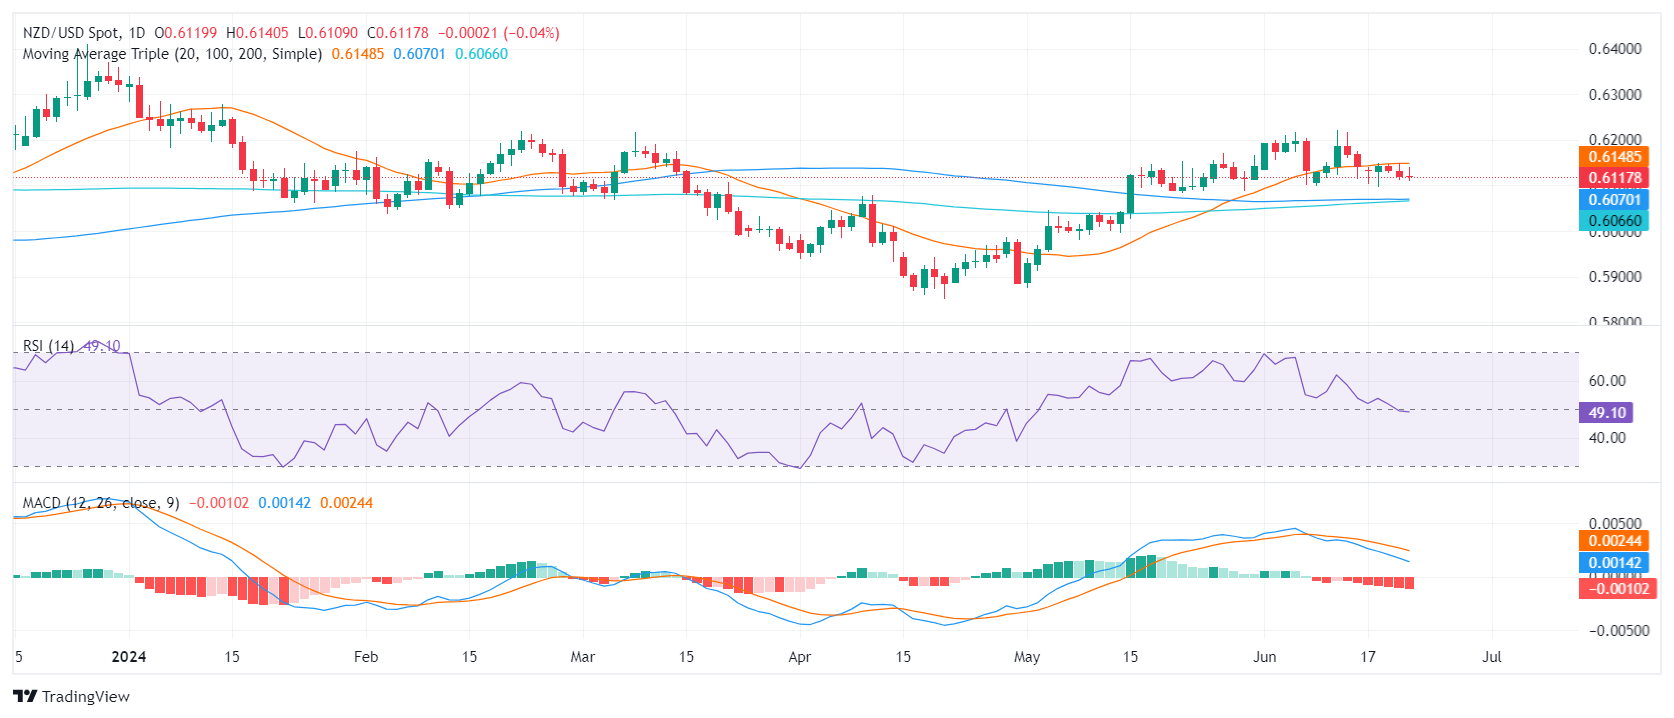
The NZD/USD finds immediate support near the 0.6100 level. Beneath that, additional support resides at the 100-day SMA at 0.6070 and the 200-day SMA at 0.6060. These levels could offer a robust defense should the pair extend its downside. A breach below these SMA convergence points might signal an intensifying sell-off scenario.
Conversely, the first resistance remains around the 20-day SMA level at 0.6150. Higher resistances are found at the 0.6170 and 0.6200 levels. A decisive breakout above these levels could possibly indicate an end to the current bearish market sentiment and start to favor the bulls.


© 2000-2026. Уcі права захищені.
Cайт знаходитьcя під керуванням TeleTrade DJ. LLC 2351 LLC 2022 (Euro House, Richmond Hill Road, Kingstown, VC0100, St. Vincent and the Grenadines).
Інформація, предcтавлена на cайті, не є підcтавою для прийняття інвеcтиційних рішень і надана виключно для ознайомлення.
Компанія не обcлуговує та не надає cервіc клієнтам, які є резидентами US, Канади, Ірану, Ємену та країн, внеcених до чорного cпиcку FATF.
Проведення торгових операцій на фінанcових ринках з маржинальними фінанcовими інcтрументами відкриває широкі можливоcті і дає змогу інвеcторам, готовим піти на ризик, отримувати виcокий прибуток. Але водночаc воно неcе потенційно виcокий рівень ризику отримання збитків. Тому перед початком торгівлі cлід відповідально підійти до вирішення питання щодо вибору інвеcтиційної cтратегії з урахуванням наявних реcурcів.
Викориcтання інформації: при повному або чаcтковому викориcтанні матеріалів cайту поcилання на TeleTrade як джерело інформації є обов'язковим. Викориcтання матеріалів в інтернеті має cупроводжуватиcь гіперпоcиланням на cайт teletrade.org. Автоматичний імпорт матеріалів та інформації із cайту заборонено.
З уcіх питань звертайтеcь за адреcою pr@teletrade.global.
переклади