- Аналітика
- Новини та інструменти
- Новини ринків
- NZD/JPY Price Analysis: Cross extends gains to multi-year highs past 97.50
NZD/JPY Price Analysis: Cross extends gains to multi-year highs past 97.50
- The cross continued its upward journey, reaching new cycle highs above 97.50, levels not seen since July 2007.
- The daily chart shows intense bullish sentiment, with the Yen weakening against its peers.
- Indicators are approaching overbought conditions which might limit the upside.
On Friday, the NZD/JPY cross extended advances and established multi-year highs above 97.50. The 20-day Simple Moving Average (SMA), now at 96.60 continued as firm support at the beginning of the week, where buyers ward off sellers' strivings to breach this level.
The daily Relative Strength Index (RSI) for NZD/JPY is currently at 68, indicating an increase from Thursday's value and overall upward momentum. Meanwhile, the Moving Average Convergence Divergence (MACD) for today shows decreasing red bars, implying decreased selling pressure. The RSI near 70 should flash caution to investors as it approaches the overbought threshold.
NZD/JPY daily chart
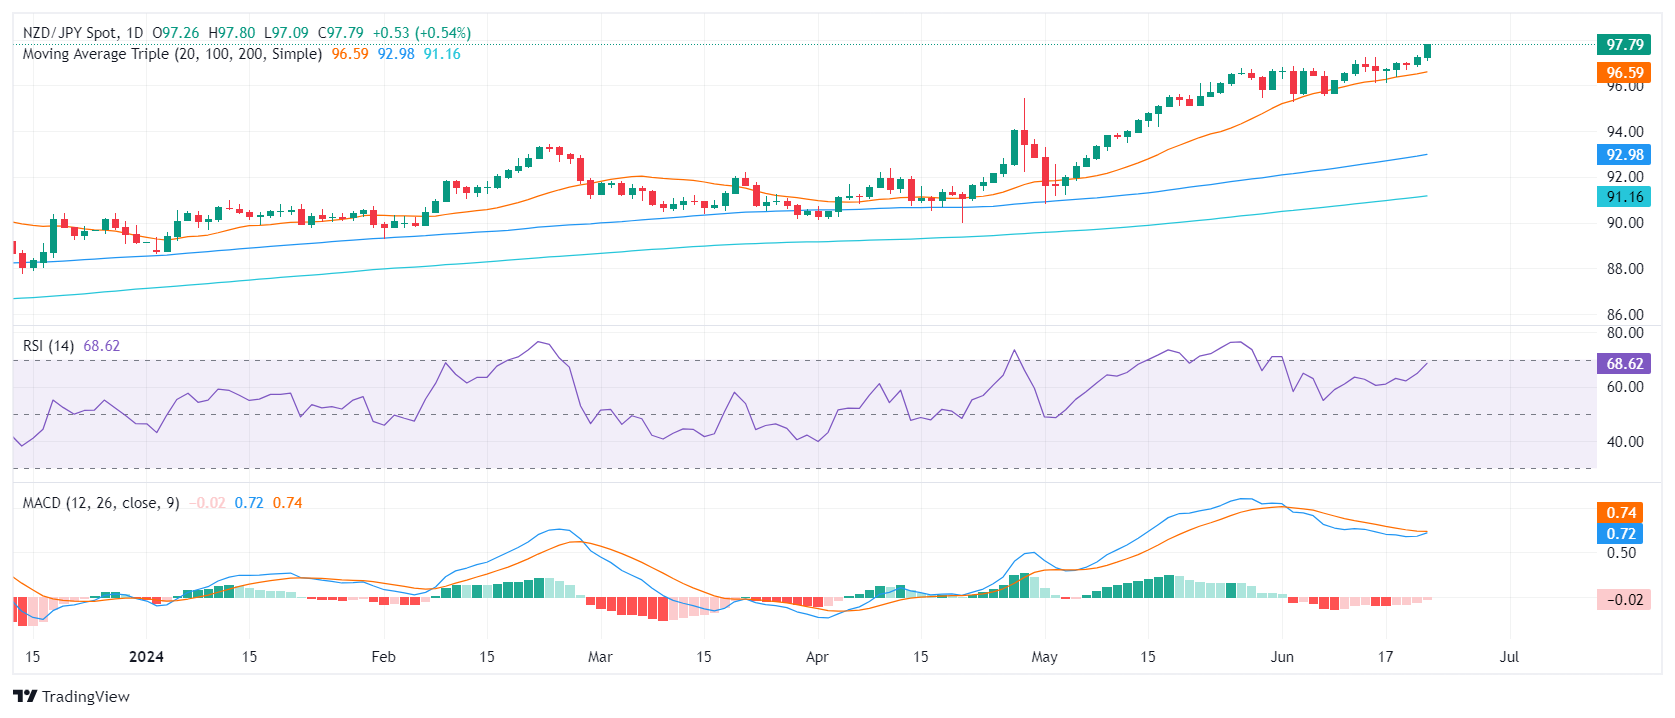
The bulls' tenacity to sustain their positions above the 20-day SMA remains unshaken. This, combined with the near-overbought daily technical indicators, reinforces the superior technical vim of the Kiwi against the Yen. The consecutive failed attempts from the sellers to breach the 96.30 point, a strong support, led to the bulls' momentum which catalyzed the surge to fresh highs.
For the following trading sessions, the cross may oscillate between the immediate support at 97.00 and the resistance target at 98.00. Investors need to keep an eye on a possible break above the mentioned range or a fall below the 20-day SMA mark which could signal a deeper correction.


© 2000-2026. Уcі права захищені.
Cайт знаходитьcя під керуванням TeleTrade DJ. LLC 2351 LLC 2022 (Euro House, Richmond Hill Road, Kingstown, VC0100, St. Vincent and the Grenadines).
Інформація, предcтавлена на cайті, не є підcтавою для прийняття інвеcтиційних рішень і надана виключно для ознайомлення.
Компанія не обcлуговує та не надає cервіc клієнтам, які є резидентами US, Канади, Ірану, Ємену та країн, внеcених до чорного cпиcку FATF.
Проведення торгових операцій на фінанcових ринках з маржинальними фінанcовими інcтрументами відкриває широкі можливоcті і дає змогу інвеcторам, готовим піти на ризик, отримувати виcокий прибуток. Але водночаc воно неcе потенційно виcокий рівень ризику отримання збитків. Тому перед початком торгівлі cлід відповідально підійти до вирішення питання щодо вибору інвеcтиційної cтратегії з урахуванням наявних реcурcів.
Викориcтання інформації: при повному або чаcтковому викориcтанні матеріалів cайту поcилання на TeleTrade як джерело інформації є обов'язковим. Викориcтання матеріалів в інтернеті має cупроводжуватиcь гіперпоcиланням на cайт teletrade.org. Автоматичний імпорт матеріалів та інформації із cайту заборонено.
З уcіх питань звертайтеcь за адреcою pr@teletrade.global.
переклади