- Аналітика
- Новини та інструменти
- Новини ринків
- Silver Price Analysis: XAG/USD climbs more than 0.50%, eyes $30.00
Silver Price Analysis: XAG/USD climbs more than 0.50%, eyes $30.00
- Silver trades and gains 0.60% after touching a daily low of $29.35.
- Momentum is neutral, with RSI around the 50-neutral line, suggesting buyers and sellers are balanced.
- Key resistance at $30.25 and $31.54, with support levels at $29.05 and $28.66.
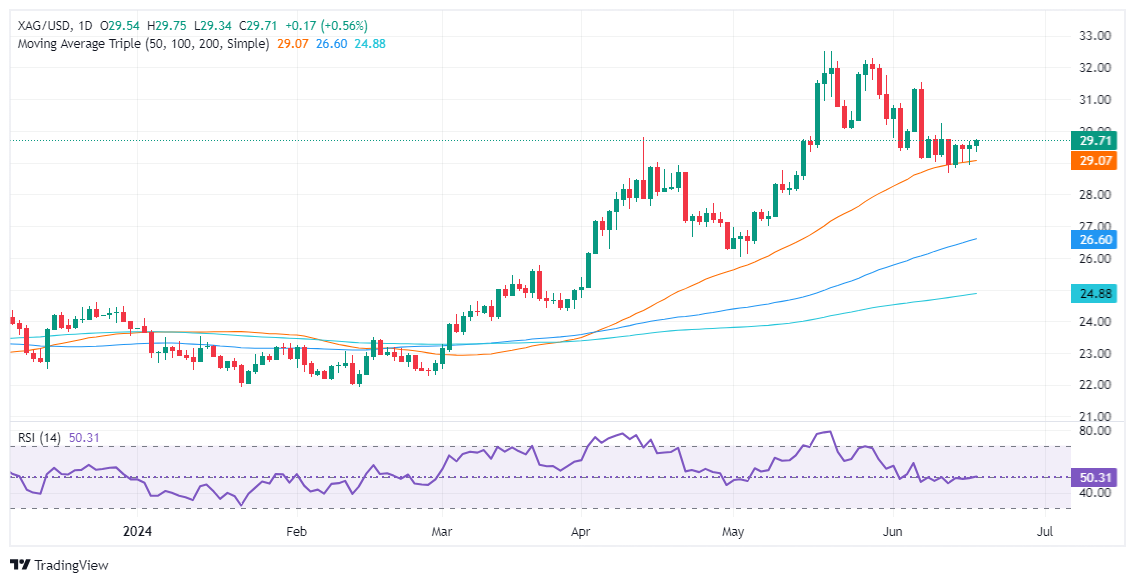
Silver climbed during the North American session, gaining more than 0.60% amid thin trading liquidity conditions. Wall Street remained closed in observance of the Juneteenth holiday. The XAG/USD trades at $29.71 after hitting a daily low of $29.35.
XAG/USD Price Analysis: Technical analysis
The grey metal remains neutral to upward bias, despite diving from year-to-date (YTD) highs reached at $32.51, below the $30.00 figure. Silver seems to have bottomed after hitting a monthly low of $28.66; since then, XAG/USD edged higher, and it’s shy of challenging the $30.00 mark.
Momentum shows that neither buyers nor sellers are in charge, as the Relative Strength Index (RSI) hovers around the 50-neutral line.
The most likely scenario would be a bullish continuation if XAG/USD buyers reclaim $30.00, which could reignite Silver’s rally and pave the way for further upside. The next resistance level would be the June 12 high at $30.25, followed by the month-to-date (MTD) high of $31.54, the June 7 peak. A breach of the latter will expose the YTD high of $32.51.
On the other hand, if XAG/USD sellers drag spot prices below the 50-day moving average (DMA) at $29.05, it will expose $29.00. Once cleared, that could expose the MTD low of $28.66, ahead of plunging toward the 100-DMA at $26.60.
XAG/USD Price Action – Daily Chart


© 2000-2026. Уcі права захищені.
Cайт знаходитьcя під керуванням TeleTrade DJ. LLC 2351 LLC 2022 (Euro House, Richmond Hill Road, Kingstown, VC0100, St. Vincent and the Grenadines).
Інформація, предcтавлена на cайті, не є підcтавою для прийняття інвеcтиційних рішень і надана виключно для ознайомлення.
Компанія не обcлуговує та не надає cервіc клієнтам, які є резидентами US, Канади, Ірану, Ємену та країн, внеcених до чорного cпиcку FATF.
Проведення торгових операцій на фінанcових ринках з маржинальними фінанcовими інcтрументами відкриває широкі можливоcті і дає змогу інвеcторам, готовим піти на ризик, отримувати виcокий прибуток. Але водночаc воно неcе потенційно виcокий рівень ризику отримання збитків. Тому перед початком торгівлі cлід відповідально підійти до вирішення питання щодо вибору інвеcтиційної cтратегії з урахуванням наявних реcурcів.
Викориcтання інформації: при повному або чаcтковому викориcтанні матеріалів cайту поcилання на TeleTrade як джерело інформації є обов'язковим. Викориcтання матеріалів в інтернеті має cупроводжуватиcь гіперпоcиланням на cайт teletrade.org. Автоматичний імпорт матеріалів та інформації із cайту заборонено.
З уcіх питань звертайтеcь за адреcою pr@teletrade.global.
переклади