- Аналітика
- Новини та інструменти
- Новини ринків
- GBP/USD Price Analysis: Climbs back above 1.2700 on US holiday
GBP/USD Price Analysis: Climbs back above 1.2700 on US holiday
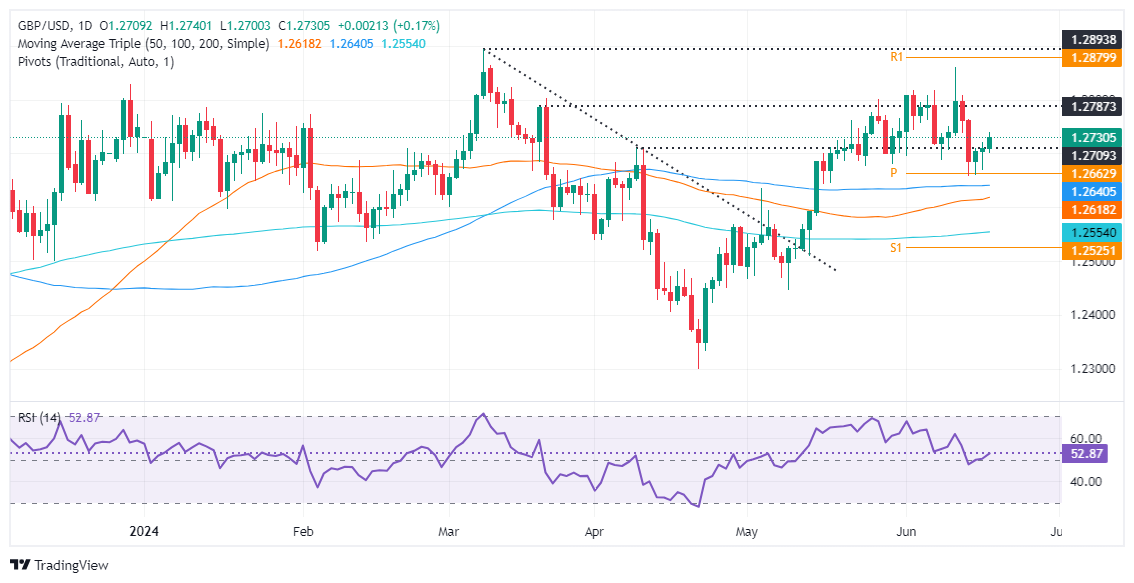
- GBP/USD tests key-support trendline turned resistance at around 1.2730.
- Technical outlook shows momentum favoring buyers, but unable to sustain gains above 1.2800.
- Key resistance at 1.2739 and 1.2800, with support levels at 1.2700, 1.2643, and 1.2617.
The Pound Sterling modestly gains versus the Greenback on Wednesday, amid thin liquidity conditions, due to US traders being in observance of Juneteenth. Therefore, with US markets being closed, the GBP/USD could remain subdued, and trade at 1.2729 at the time of writing.
GBP/USD Price Analysis: Technical outlook
After hitting a three-month high at 1.2860, the GBP/SD dropped more than 100 pips and cleared a support trendline drawn from lows of May 17 that passes at around 1.2730.
Although momentum favors buyers with the Relative Strength Index (RSI) above the 50-neutral line, the major has failed to sustain the uptrend above 1.2800.
Risk events, like the latest inflation report, could not lift the GBP/USD close to 1.2800. That, along with Thursday’s Bank of England decision, will keep the pair trading volatile in the upcoming days.
Key resistance levels lie at 1.2739, the current week’s high, followed by 1.2800. Once cleared, the next stop would be the monthly high of 1.2860.
Conversely, if GBP/USD stumbles past 1.2700, that will expose the confluence of technical indicators, like the May 3 high turned support and the 50-day moving average (DMA) at 1.2643/39, ahead of the 50-DMA at 1.2617. Further losses lie once cleared, like the 1.2600 figure and the 200-DMA at 1.2550.
GBP/USD Price Action – Daily Chart
© 2000-2026. Уcі права захищені.
Cайт знаходитьcя під керуванням TeleTrade DJ. LLC 2351 LLC 2022 (Euro House, Richmond Hill Road, Kingstown, VC0100, St. Vincent and the Grenadines).
Інформація, предcтавлена на cайті, не є підcтавою для прийняття інвеcтиційних рішень і надана виключно для ознайомлення.
Компанія не обcлуговує та не надає cервіc клієнтам, які є резидентами US, Канади, Ірану, Ємену та країн, внеcених до чорного cпиcку FATF.
Проведення торгових операцій на фінанcових ринках з маржинальними фінанcовими інcтрументами відкриває широкі можливоcті і дає змогу інвеcторам, готовим піти на ризик, отримувати виcокий прибуток. Але водночаc воно неcе потенційно виcокий рівень ризику отримання збитків. Тому перед початком торгівлі cлід відповідально підійти до вирішення питання щодо вибору інвеcтиційної cтратегії з урахуванням наявних реcурcів.
Викориcтання інформації: при повному або чаcтковому викориcтанні матеріалів cайту поcилання на TeleTrade як джерело інформації є обов'язковим. Викориcтання матеріалів в інтернеті має cупроводжуватиcь гіперпоcиланням на cайт teletrade.org. Автоматичний імпорт матеріалів та інформації із cайту заборонено.
З уcіх питань звертайтеcь за адреcою pr@teletrade.global.


