- Аналітика
- Новини та інструменти
- Новини ринків
- NZD/JPY Price Analysis: Kiwi gains ground and test the 97.00 level
NZD/JPY Price Analysis: Kiwi gains ground and test the 97.00 level
- The Kiwi sees gains against the Yen, approaching the 97.00 resistance point.
- Daily chart indicators reflect strength, hinting at potential up-move continuation.
- Resistance looms at 97.00- 98.00; however, strong buying traction could drive a breakout to the upside.
In Tuesday's session, the NZD/JPY pair saw promising upticks, edging closer to the 97.00 resistance point after a strong defense of the 20-day Simple Moving Average (SMA) at 96.30, which has proven to be resilient against sellers' attempts.
The daily Relative Strength Index (RSI) for NZD/JPY now registers 63, indicating a positive shift and an increase in buying momentum. On the other hand, the Moving Average Convergence Divergence (MACD) continues to print decreasing red bars, suggesting the ongoing consolidation phase may ease for an upward climb.
NZD/JPY daily chart
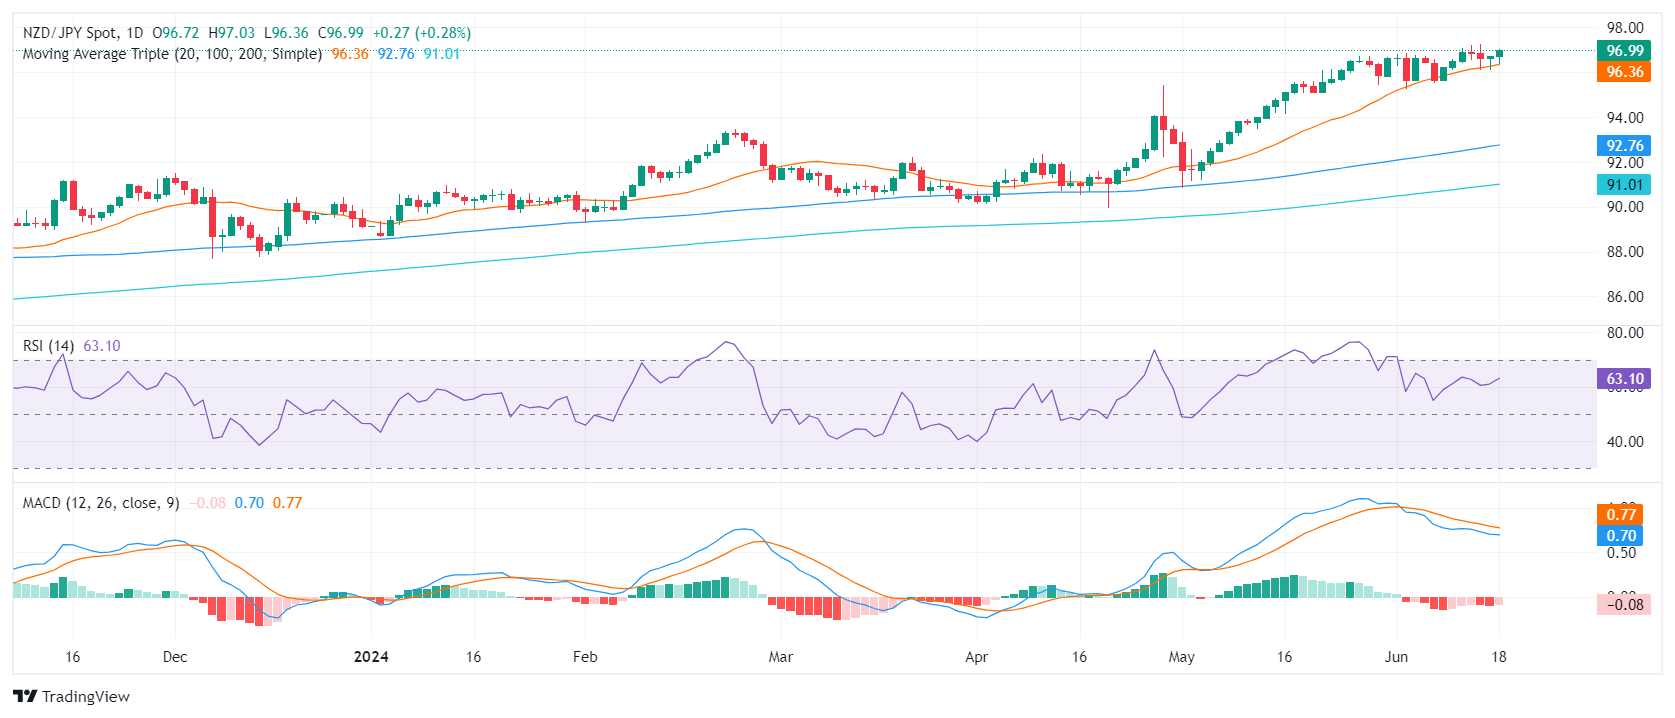
In a determined effort, buyers continue to hold their positions above the 20-day Simple Moving Average (SMA) in a bid to solidify the bullish trend's longevity. The recent upward shifts noted in the daily technical indicators highlight an intention among market participants to bring the consolidation phase to an end. In the last sessions, the pair side-ways traded using the 20-day SMA as a support and buyers seem to be back on track after a brief breather.
Incoming trading sessions might see the pair navigating the territory between support levels at 96.30 (20-day SMA) and 95.00, and resistance level at 97.00, aiming for the recent high near 97.30. Notably, the resilience of buyers defending the 20-day SMA at 96.30 is a promising sign for a potential upward continuation. Below those levels, the long-term 100 and 200-day Simple Moving Averages (SMAs) at approximately 92.00 - 91.00, respectively, continue providing overall support for the bullish narrative.


© 2000-2026. Уcі права захищені.
Cайт знаходитьcя під керуванням TeleTrade DJ. LLC 2351 LLC 2022 (Euro House, Richmond Hill Road, Kingstown, VC0100, St. Vincent and the Grenadines).
Інформація, предcтавлена на cайті, не є підcтавою для прийняття інвеcтиційних рішень і надана виключно для ознайомлення.
Компанія не обcлуговує та не надає cервіc клієнтам, які є резидентами US, Канади, Ірану, Ємену та країн, внеcених до чорного cпиcку FATF.
Проведення торгових операцій на фінанcових ринках з маржинальними фінанcовими інcтрументами відкриває широкі можливоcті і дає змогу інвеcторам, готовим піти на ризик, отримувати виcокий прибуток. Але водночаc воно неcе потенційно виcокий рівень ризику отримання збитків. Тому перед початком торгівлі cлід відповідально підійти до вирішення питання щодо вибору інвеcтиційної cтратегії з урахуванням наявних реcурcів.
Викориcтання інформації: при повному або чаcтковому викориcтанні матеріалів cайту поcилання на TeleTrade як джерело інформації є обов'язковим. Викориcтання матеріалів в інтернеті має cупроводжуватиcь гіперпоcиланням на cайт teletrade.org. Автоматичний імпорт матеріалів та інформації із cайту заборонено.
З уcіх питань звертайтеcь за адреcою pr@teletrade.global.
переклади