- Аналітика
- Новини та інструменти
- Новини ринків
- AUD/JPY Price Analysis: Bulls propels pair near 105.00
AUD/JPY Price Analysis: Bulls propels pair near 105.00
- AUD/JPY got propelled near 105.00 on Tuesday, driven by the Reserve Bank of Australia RBA's hawkish hold.
- Tusaday's move confirms a positive short-term outlook.
- Fundamentals may have driven the pair out of the consolidation phase seen in the last sessions.
In Tuesday's session, the AUD/JPY pair received a boost following the Reserve Bank of Australia (RBA)'s hawkish hold, with the momentum propelling the pair towards the 105.00 level. In the last sessions, price action saw a consolidation above the 104.00 level, which supported the pair now to retest cycle highs.
On the daily scale, the Relative Strength Index (RSI) stands at 62, indicating rising buying pressure and shifting into bullish territory. However, it is important to observe that the Moving Average Convergence Divergence (MACD) line is below the signal line, hinting that there is still bearish activity. Traders will need to keep an eye on a possible crossover in the upcoming sessions to confirm the continuation of Tuesday's bullish movements.
AUD/JPY daily chart
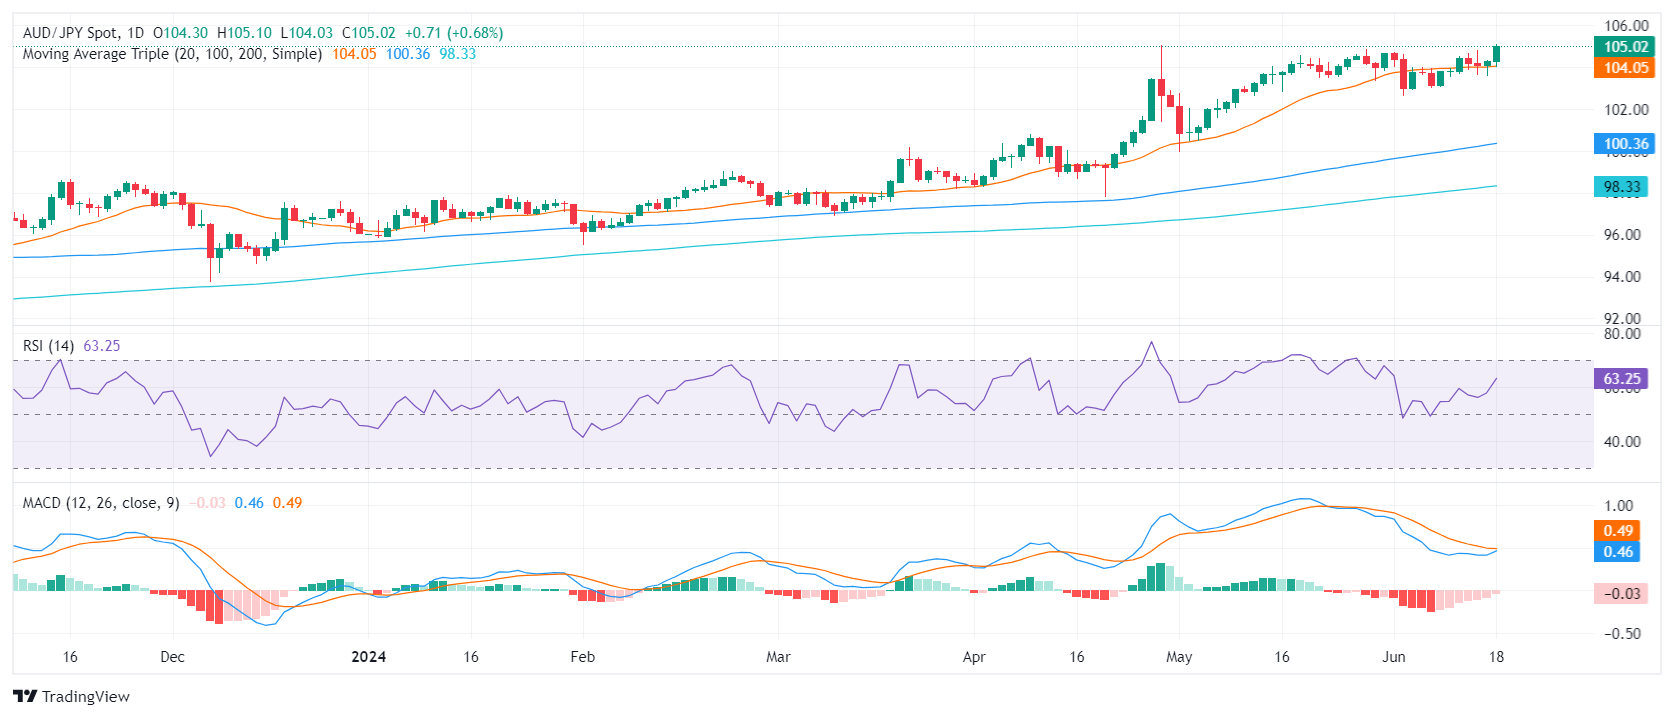
To sum it up, the AUD/JPY pair's solid performance on Tuesday supplements a broader bullish trend, with the trend's strength substantiated by the pair's value above the 20-day, 100-day, and 200-day SMAs. In the next sessions, traders can expect the pair to continue its uptrend movement within the 105.00-106.00 range as bulls have terrain to continue climbing with indicators far from overbought conditions.
On the flip side, if there is a breach below the established support level at 104.00 (20-day SMA), the pair may be prompted to find new support levels. The 102.50 and 100.35 levels are hence seen as the next potential support lines.


© 2000-2026. Уcі права захищені.
Cайт знаходитьcя під керуванням TeleTrade DJ. LLC 2351 LLC 2022 (Euro House, Richmond Hill Road, Kingstown, VC0100, St. Vincent and the Grenadines).
Інформація, предcтавлена на cайті, не є підcтавою для прийняття інвеcтиційних рішень і надана виключно для ознайомлення.
Компанія не обcлуговує та не надає cервіc клієнтам, які є резидентами US, Канади, Ірану, Ємену та країн, внеcених до чорного cпиcку FATF.
Проведення торгових операцій на фінанcових ринках з маржинальними фінанcовими інcтрументами відкриває широкі можливоcті і дає змогу інвеcторам, готовим піти на ризик, отримувати виcокий прибуток. Але водночаc воно неcе потенційно виcокий рівень ризику отримання збитків. Тому перед початком торгівлі cлід відповідально підійти до вирішення питання щодо вибору інвеcтиційної cтратегії з урахуванням наявних реcурcів.
Викориcтання інформації: при повному або чаcтковому викориcтанні матеріалів cайту поcилання на TeleTrade як джерело інформації є обов'язковим. Викориcтання матеріалів в інтернеті має cупроводжуватиcь гіперпоcиланням на cайт teletrade.org. Автоматичний імпорт матеріалів та інформації із cайту заборонено.
З уcіх питань звертайтеcь за адреcою pr@teletrade.global.
переклади