- Аналітика
- Новини та інструменти
- Новини ринків
- EUR/USD Price Analysis: Holds below 1.0750 ahead of US Retail Sales data
EUR/USD Price Analysis: Holds below 1.0750 ahead of US Retail Sales data
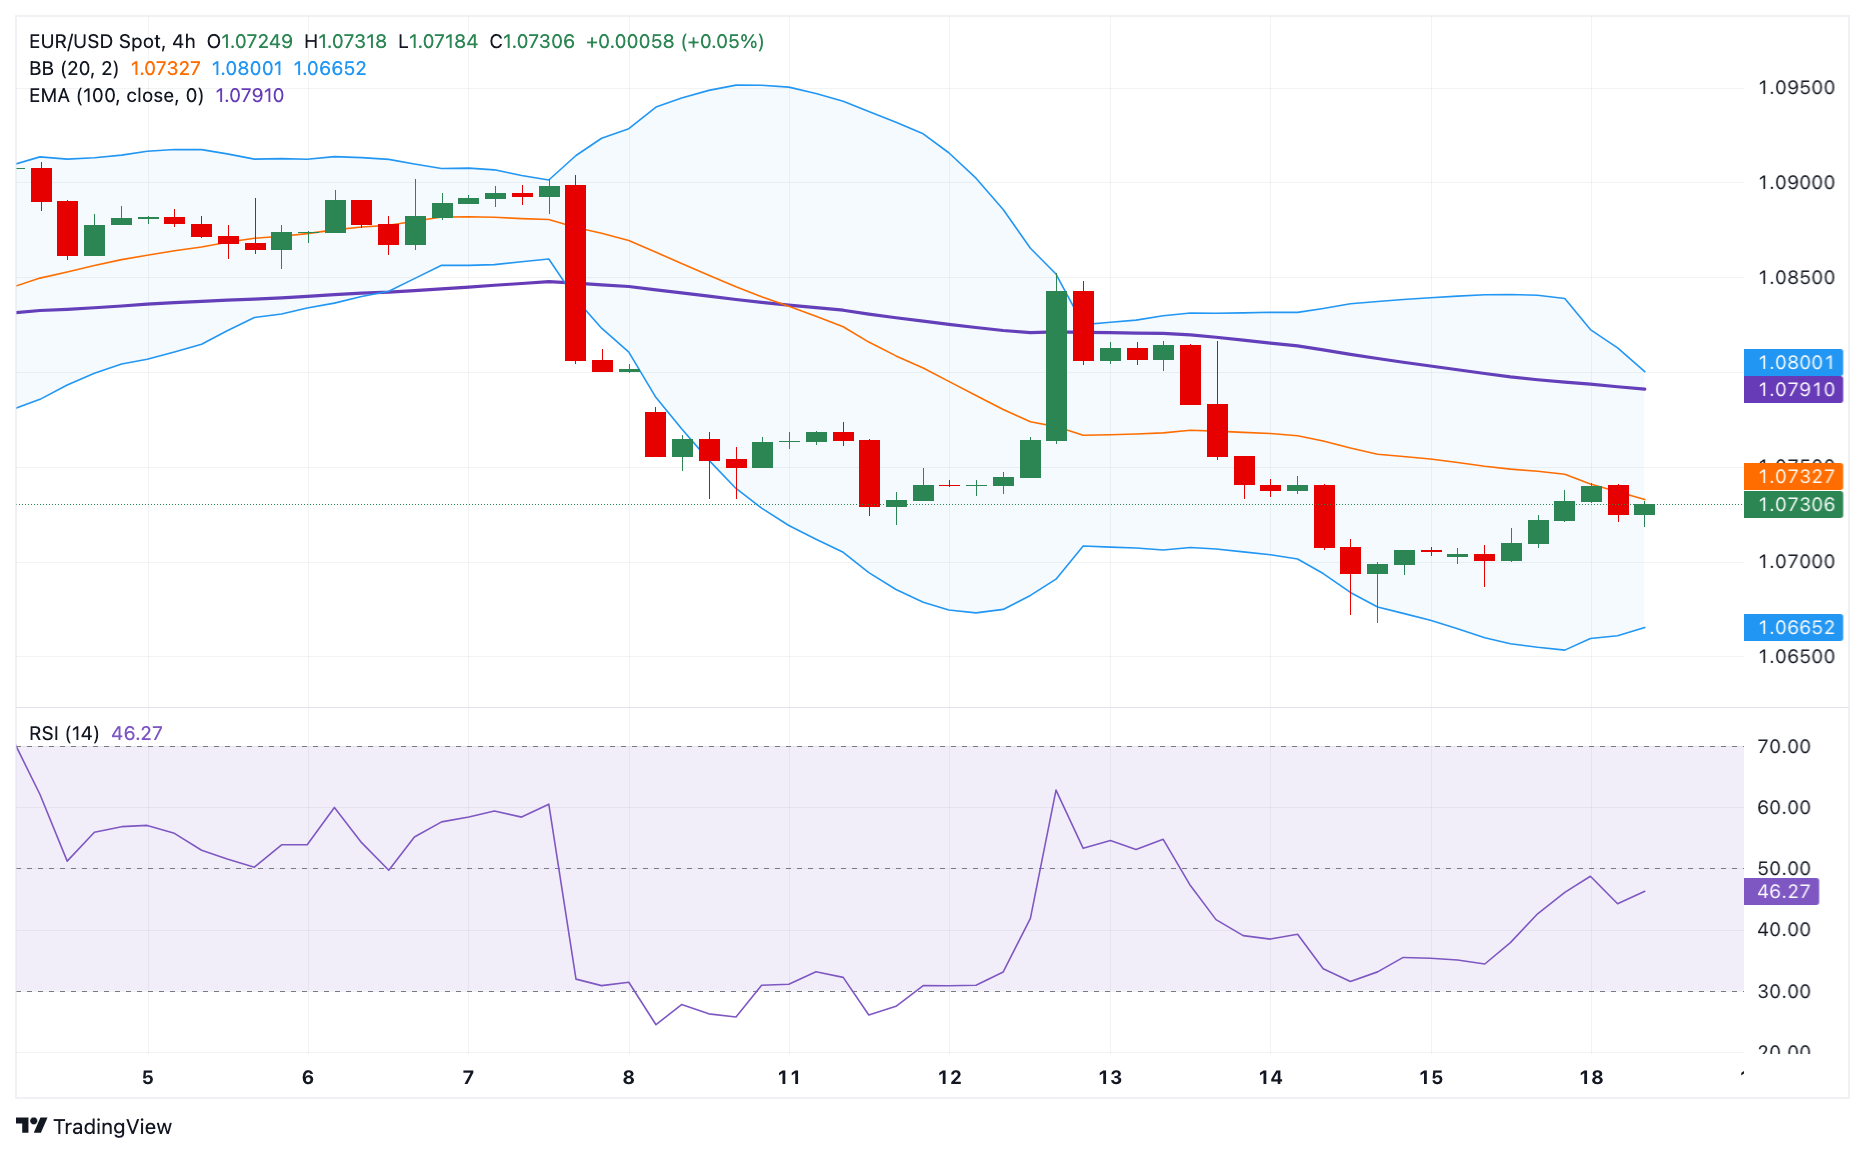
- EUR/USD weakens around 1.0730 in Tuesday’s early European session.
- The negative outlook of the pair remains intact below the key 100-period EMA, with a bearish RSI indicator.
- The initial support level is seen at 1.0685; the key resistance level is located in the 1.0790–1.0800 zone.
The EUR/USD pair trades on a softer note near 1.0730 on Tuesday during the early European trading hours. The modest recovery of the Greenback drags the major pair lower. Traders prefer to wait on the sidelines ahead of the Eurozone Harmonized Index of Consumer Prices (HICP) inflation data and the US Retail Sales data. Retail Sales in the US are expected to rise 0.2% MoM in May.
According to the 4-hour chart, EUR/USD keeps the bearish vibe unchanged as the major pair holds below the key 100-period Exponential Moving Average (EMA). The downward momentum is supported by the Relative Strength Index (RSI), which stands in the bearish zone near 43.0,. This suggests that the path of least resistance is to the downside.
The initial support level for the major pair is seen at 1.0685, a low of June 17. Further south, the downside target to watch is 1.0665, the lower limit of Bollinger Band. A break below the latter will see a drop to 1.0610, a low of April 19.
On the upside, any follow-through buying above an intraday high of 1.0741 will see a rally to the crucial upside barrier at the 1.0790–1.0800 region. The mentioned level is the confluence of the upper boundary of the Bollinger Band and the psychological level. A break above this level will pave the way to 1.0852, a high of June 12.
EUR/USD 4-hour chart


© 2000-2026. Уcі права захищені.
Cайт знаходитьcя під керуванням TeleTrade DJ. LLC 2351 LLC 2022 (Euro House, Richmond Hill Road, Kingstown, VC0100, St. Vincent and the Grenadines).
Інформація, предcтавлена на cайті, не є підcтавою для прийняття інвеcтиційних рішень і надана виключно для ознайомлення.
Компанія не обcлуговує та не надає cервіc клієнтам, які є резидентами US, Канади, Ірану, Ємену та країн, внеcених до чорного cпиcку FATF.
Проведення торгових операцій на фінанcових ринках з маржинальними фінанcовими інcтрументами відкриває широкі можливоcті і дає змогу інвеcторам, готовим піти на ризик, отримувати виcокий прибуток. Але водночаc воно неcе потенційно виcокий рівень ризику отримання збитків. Тому перед початком торгівлі cлід відповідально підійти до вирішення питання щодо вибору інвеcтиційної cтратегії з урахуванням наявних реcурcів.
Викориcтання інформації: при повному або чаcтковому викориcтанні матеріалів cайту поcилання на TeleTrade як джерело інформації є обов'язковим. Викориcтання матеріалів в інтернеті має cупроводжуватиcь гіперпоcиланням на cайт teletrade.org. Автоматичний імпорт матеріалів та інформації із cайту заборонено.
З уcіх питань звертайтеcь за адреcою pr@teletrade.global.
переклади