- Аналітика
- Новини та інструменти
- Новини ринків
- NZD/USD Price Analysis: Further decline observed as the pair fails to hold the 20-day SMA
NZD/USD Price Analysis: Further decline observed as the pair fails to hold the 20-day SMA
- The NZD/USD slips further below the 20-day SMA as bears reinforce their strength.
- Daily chart indicators suggest an ongoing consolidation phase, marked by a slight negative momentum following last Wednesday’s push.
- The pair fell to a low of 0.6105 but bulls managed to clear most of its losses.
The NZD/USD continued its descent on Monday, moving below the 20-day Simple Moving Average (SMA) of 0.6140 the buyers managed to clear most of its daily losses. The pair seems to be stuck in a state of consolidation following the sharp surge last week to 0.6220. Despite buyers' attempts, the 20-day SMA could not be sustained, and losses could potentially extend if this trend continues.
Meanwhile, on the daily chart, the Relative Strength Index (RSI) has maintained its negative momentum, suggesting a faltering buying pressure. The downward orientation of the RSI is consistent with the flat red bars displayed by the Moving Average Convergence Divergence (MACD), further emphasizing the ongoing consolidation narrative.
NZD/USD daily chart
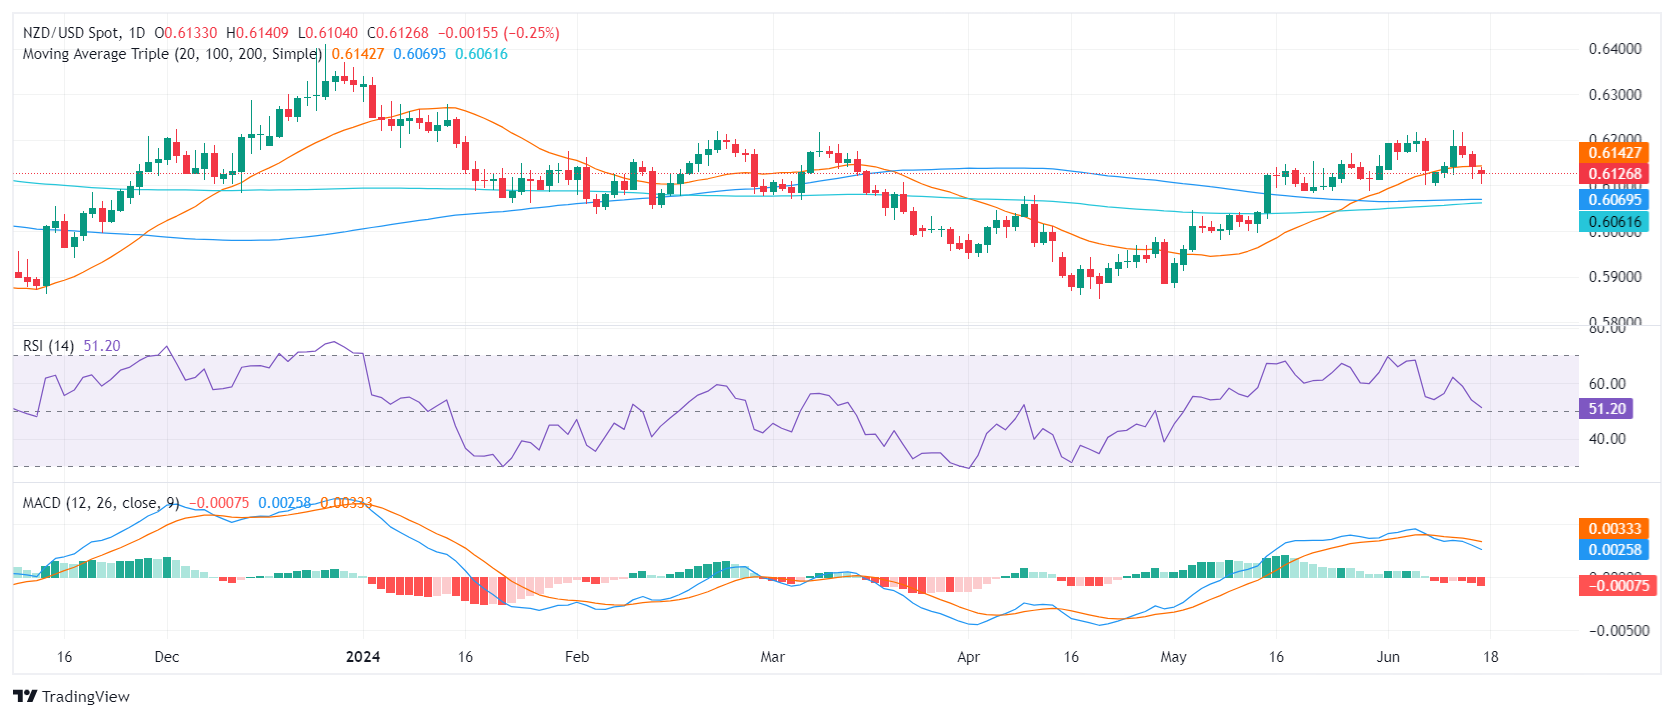
The NZD/USD's immediate resistance level stands at the 20-day SMA of 0.6140. Simultaneously, the convergence of the 100 and 200-day SMAs in the 0.6050-0.6060 region builds a sturdy support base for the pair, which is likely to aid in correction should the bears seize control. Movements below this convergence point could indicate sell conditions.
Furthermore, the main resistance continues to stand at the 0.6200 level. A breach at this point could be viewed as a buy signal, signaling an overturn of the bearish sentiment.


© 2000-2026. Уcі права захищені.
Cайт знаходитьcя під керуванням TeleTrade DJ. LLC 2351 LLC 2022 (Euro House, Richmond Hill Road, Kingstown, VC0100, St. Vincent and the Grenadines).
Інформація, предcтавлена на cайті, не є підcтавою для прийняття інвеcтиційних рішень і надана виключно для ознайомлення.
Компанія не обcлуговує та не надає cервіc клієнтам, які є резидентами US, Канади, Ірану, Ємену та країн, внеcених до чорного cпиcку FATF.
Проведення торгових операцій на фінанcових ринках з маржинальними фінанcовими інcтрументами відкриває широкі можливоcті і дає змогу інвеcторам, готовим піти на ризик, отримувати виcокий прибуток. Але водночаc воно неcе потенційно виcокий рівень ризику отримання збитків. Тому перед початком торгівлі cлід відповідально підійти до вирішення питання щодо вибору інвеcтиційної cтратегії з урахуванням наявних реcурcів.
Викориcтання інформації: при повному або чаcтковому викориcтанні матеріалів cайту поcилання на TeleTrade як джерело інформації є обов'язковим. Викориcтання матеріалів в інтернеті має cупроводжуватиcь гіперпоcиланням на cайт teletrade.org. Автоматичний імпорт матеріалів та інформації із cайту заборонено.
З уcіх питань звертайтеcь за адреcою pr@teletrade.global.
переклади