- Аналітика
- Новини та інструменти
- Новини ринків
- AUD/JPY Price Analysis: Mild gains prompt building support around 20-day SMA
AUD/JPY Price Analysis: Mild gains prompt building support around 20-day SMA
- The AUD/JPY showed tepid losses on Monday and then recovered, focusing on building support around the 20-day SMA regained last week.
- Given continued side-ways trading, the pair might move in the 104.00 - 105.00 range.
In Monday's session, the AUD/JPY pair experienced limited losses and then recovered to trade with gains, with attention focused on reinforcing the support at the 20-day Simple Moving Average (SMA), after dipping briefly below 103.60 and then recovering it back. The price recovery above the 104.00 level indicates the robust supportive role played by this SMA, which once served as a barrier to the bulls.
On a daily scale, the Relative Strength Index (RSI) stands flat at 57. This neutral stance indicates a weak buying pressure and that the overall technical outlook remains balanced. Likewise, the Moving Average Convergence Divergence (MACD) continues to show flat red bars, indicating a steady selling momentum.
AUD/JPY daily chart
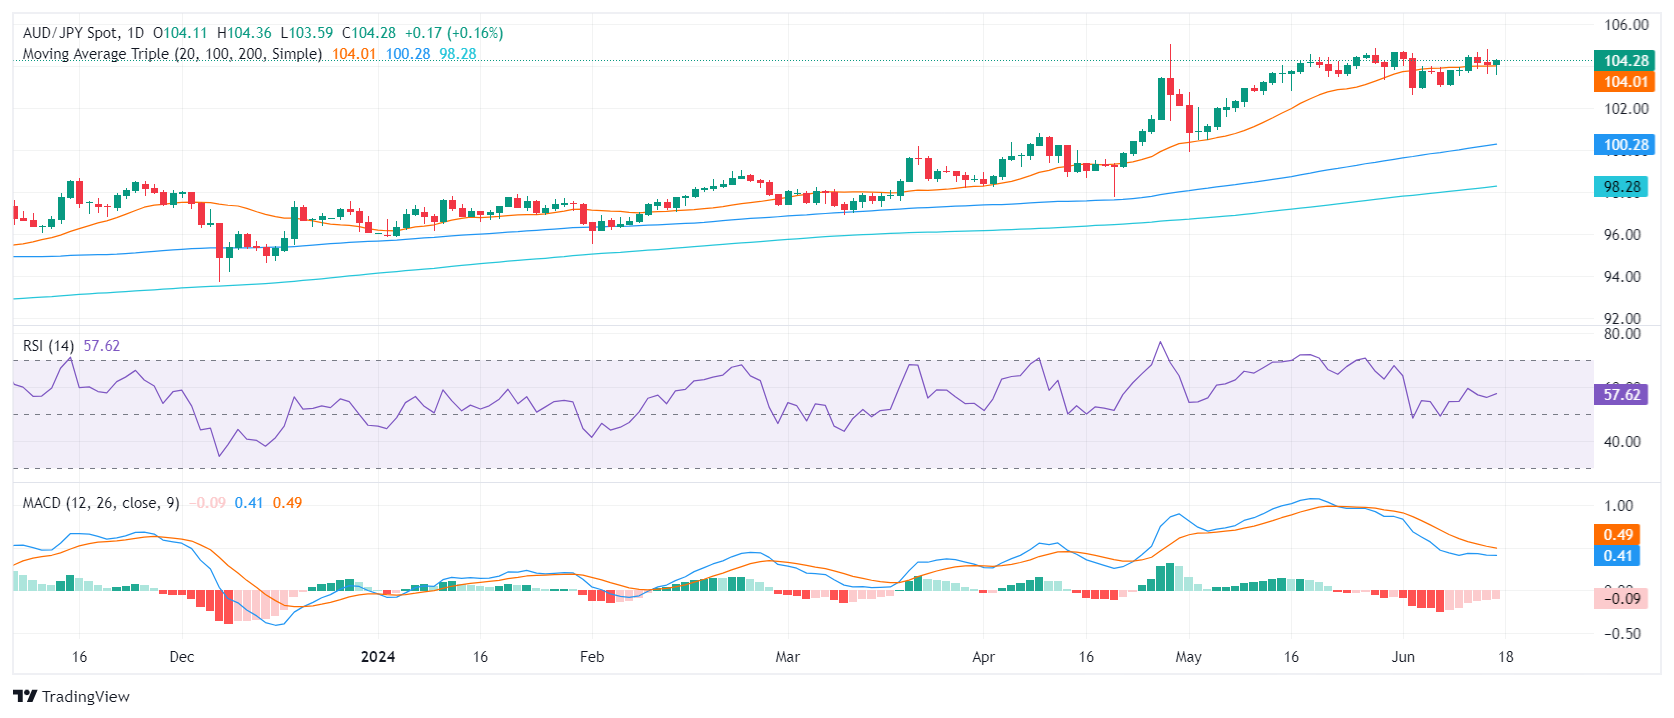
Summing up, ongoing consolidation is the trend for the AUD/JPY pair, despite a small loss on Monday, with trading activity focused around the 20-day SMA. This situation leads to an expectation of continued sideways trading within the 104.00-105.00 range for the forthcoming sessions, as bulls are consolidating the gains from May's rally that took the pair near the 105.00 level.
However, the periods of consolidation suggest a prep phase for bulls aiming for the 104.50-105.00 range once again. On the other hand, a breach below the 20-day SMA could tempt the sellers, with support lining up at 103.60, just below the mentioned SMA. Further supports exist at 102.60, and long-term at the 100 and 200-day SMAs, situated in the 100.00 to 98.00 bracket.


© 2000-2026. Уcі права захищені.
Cайт знаходитьcя під керуванням TeleTrade DJ. LLC 2351 LLC 2022 (Euro House, Richmond Hill Road, Kingstown, VC0100, St. Vincent and the Grenadines).
Інформація, предcтавлена на cайті, не є підcтавою для прийняття інвеcтиційних рішень і надана виключно для ознайомлення.
Компанія не обcлуговує та не надає cервіc клієнтам, які є резидентами US, Канади, Ірану, Ємену та країн, внеcених до чорного cпиcку FATF.
Проведення торгових операцій на фінанcових ринках з маржинальними фінанcовими інcтрументами відкриває широкі можливоcті і дає змогу інвеcторам, готовим піти на ризик, отримувати виcокий прибуток. Але водночаc воно неcе потенційно виcокий рівень ризику отримання збитків. Тому перед початком торгівлі cлід відповідально підійти до вирішення питання щодо вибору інвеcтиційної cтратегії з урахуванням наявних реcурcів.
Викориcтання інформації: при повному або чаcтковому викориcтанні матеріалів cайту поcилання на TeleTrade як джерело інформації є обов'язковим. Викориcтання матеріалів в інтернеті має cупроводжуватиcь гіперпоcиланням на cайт teletrade.org. Автоматичний імпорт матеріалів та інформації із cайту заборонено.
З уcіх питань звертайтеcь за адреcою pr@teletrade.global.
переклади