- Аналітика
- Новини та інструменти
- Новини ринків
- NZD/JPY Price Analysis: Bulls try to maintain the uptrend despite persisting consolidation
NZD/JPY Price Analysis: Bulls try to maintain the uptrend despite persisting consolidation
- The consolidation phase extends as the Kiwi witnesses difficulty against the Yen.
- Indicators on the daily chart trend downwards, indicating potential for further consolidation in the upcoming sessions.
- Retesting the 97.00 level could be on the cards, but a break above this resistance appears unlikely due to weak buying traction.
On Monday, the NZD/JPY pair extended its consolidation phase after hitting a multi-year high last week. The technical landscape suggests that sellers may have their chance as consolidation continues, potentially limiting the pair's upward movement under the key resistance level of 97.00. However, the 20-day Simple Moving Average (SMA) is holding as strong support and bulls continue to defend it.
The daily Relative Strength Index (RSI) for NZD/JPY now stands at 60, indicating a slight retracement downwards and a decrease in the bullish momentum. The Moving Average Convergence Divergence (MACD) continues to print rising red bars, indicating an ongoing consolidation phase.
NZD/JPY daily chart
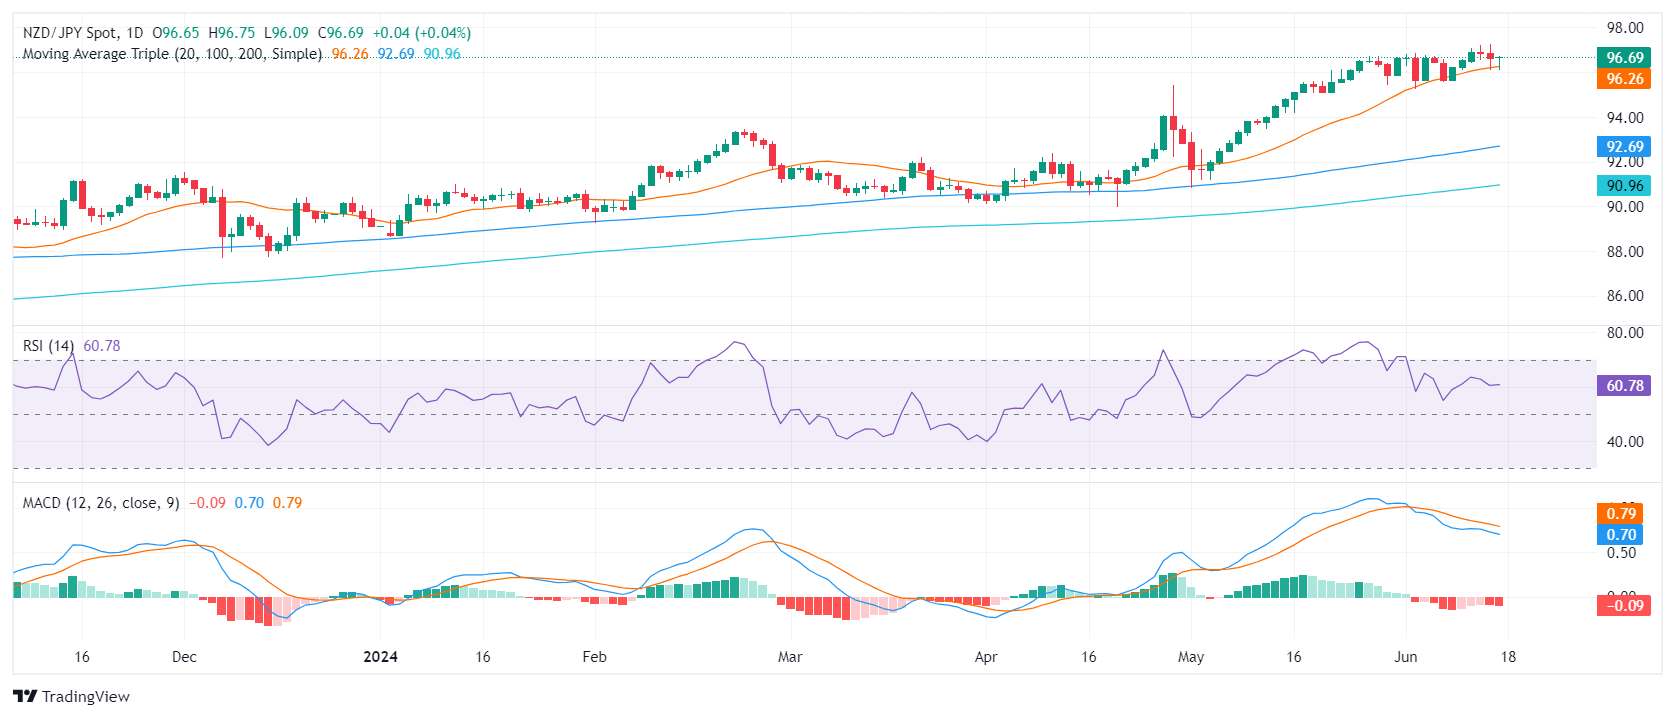
Buyers continue to maintain their stand above the 20-day Simple Moving Average (SMA), demonstrating an effort to uphold the bullish trend. Regardless, the downturn observed in the daily technical indicators points towards the market's need for further consolidation after the significant leap to nearly 96.00 since May.
The upcoming trading sessions might witness the pair movings between the support level of 95.00 and the resistance level of 97.00 as this pair remains among the tallest since June 2007. Notably, the bears have struggled twice consecutively to breach the 20-day SMA at 96.20, making it unlikely for the downtrend to continue The longer-term 100-day and 200-day Simple Moving Averages (SMAs), established roughly around 90.00 - 92.00, continue to protect the overall bullish aspect of the pair. The area around 95.30 also offers substantial support against potential losses.


© 2000-2026. Уcі права захищені.
Cайт знаходитьcя під керуванням TeleTrade DJ. LLC 2351 LLC 2022 (Euro House, Richmond Hill Road, Kingstown, VC0100, St. Vincent and the Grenadines).
Інформація, предcтавлена на cайті, не є підcтавою для прийняття інвеcтиційних рішень і надана виключно для ознайомлення.
Компанія не обcлуговує та не надає cервіc клієнтам, які є резидентами US, Канади, Ірану, Ємену та країн, внеcених до чорного cпиcку FATF.
Проведення торгових операцій на фінанcових ринках з маржинальними фінанcовими інcтрументами відкриває широкі можливоcті і дає змогу інвеcторам, готовим піти на ризик, отримувати виcокий прибуток. Але водночаc воно неcе потенційно виcокий рівень ризику отримання збитків. Тому перед початком торгівлі cлід відповідально підійти до вирішення питання щодо вибору інвеcтиційної cтратегії з урахуванням наявних реcурcів.
Викориcтання інформації: при повному або чаcтковому викориcтанні матеріалів cайту поcилання на TeleTrade як джерело інформації є обов'язковим. Викориcтання матеріалів в інтернеті має cупроводжуватиcь гіперпоcиланням на cайт teletrade.org. Автоматичний імпорт матеріалів та інформації із cайту заборонено.
З уcіх питань звертайтеcь за адреcою pr@teletrade.global.
переклади