- Analytics
- News and Tools
- Market News
- WTI Oil Price Analysis: Closing in on cluster of resistance in the $79.00s
WTI Oil Price Analysis: Closing in on cluster of resistance in the $79.00s
- Oil is rising up to a cluster of daily major moving averages in the $79.00s.
- These will probably present a tough level of resistance for the commodity.
- The persistence of the short-term uptrend will depend on a decisive break of this resistance barrier.
WTI Oil is trading in the $78.50s during the US session on Friday.
On the 4-hour chart used to assess the short-term trend Oil has decisively broken out a falling channel and reached the conservative target for the breakout at $78.17 (Fibonacci 0.618 extension of the width of the channel extrapolated higher).
Oil 4-Hour Chart
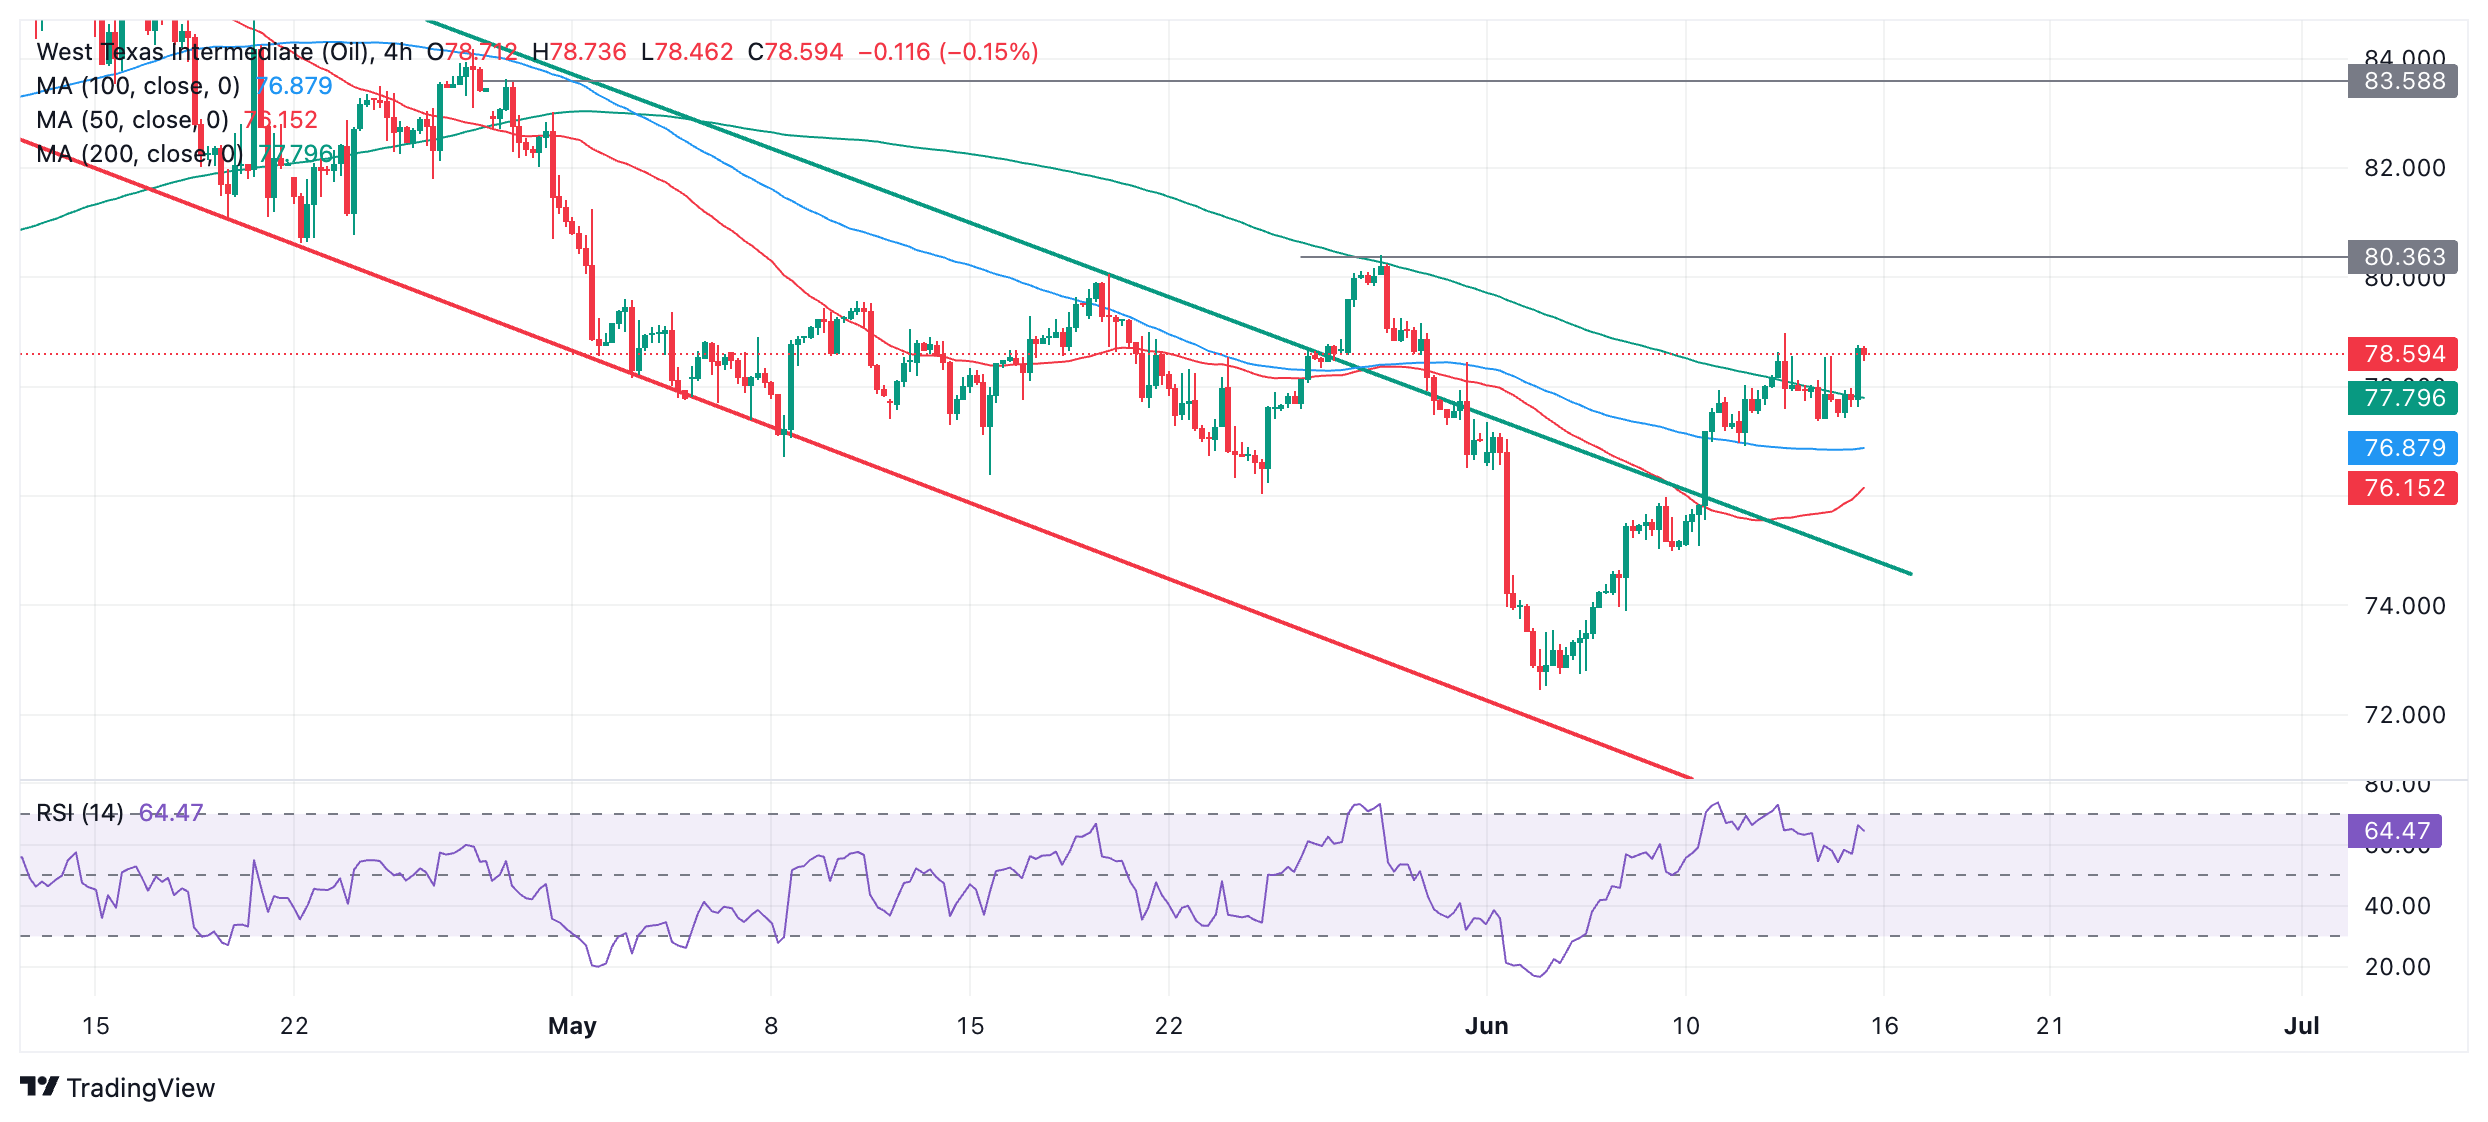
Since breaking out of the channel, Oil is probably now in a short-term uptrend with the odds favoring more upside in the short-term, given “the trend is your friend”. However, it has now reached its initial target so is vulnerable to a pullback.
A breakout above the last lower high of the prior downtrend at $80.36 (May 29 high) would provide added bullish confirmation and extend the uptrend higher. Such a move might be expected to reach the next key target at $83.50 (April 29 high and top of chart gap).
The direction of Oil is less clear on the daily chart used to assess the intermediate term trend.
Oil Daily Chart
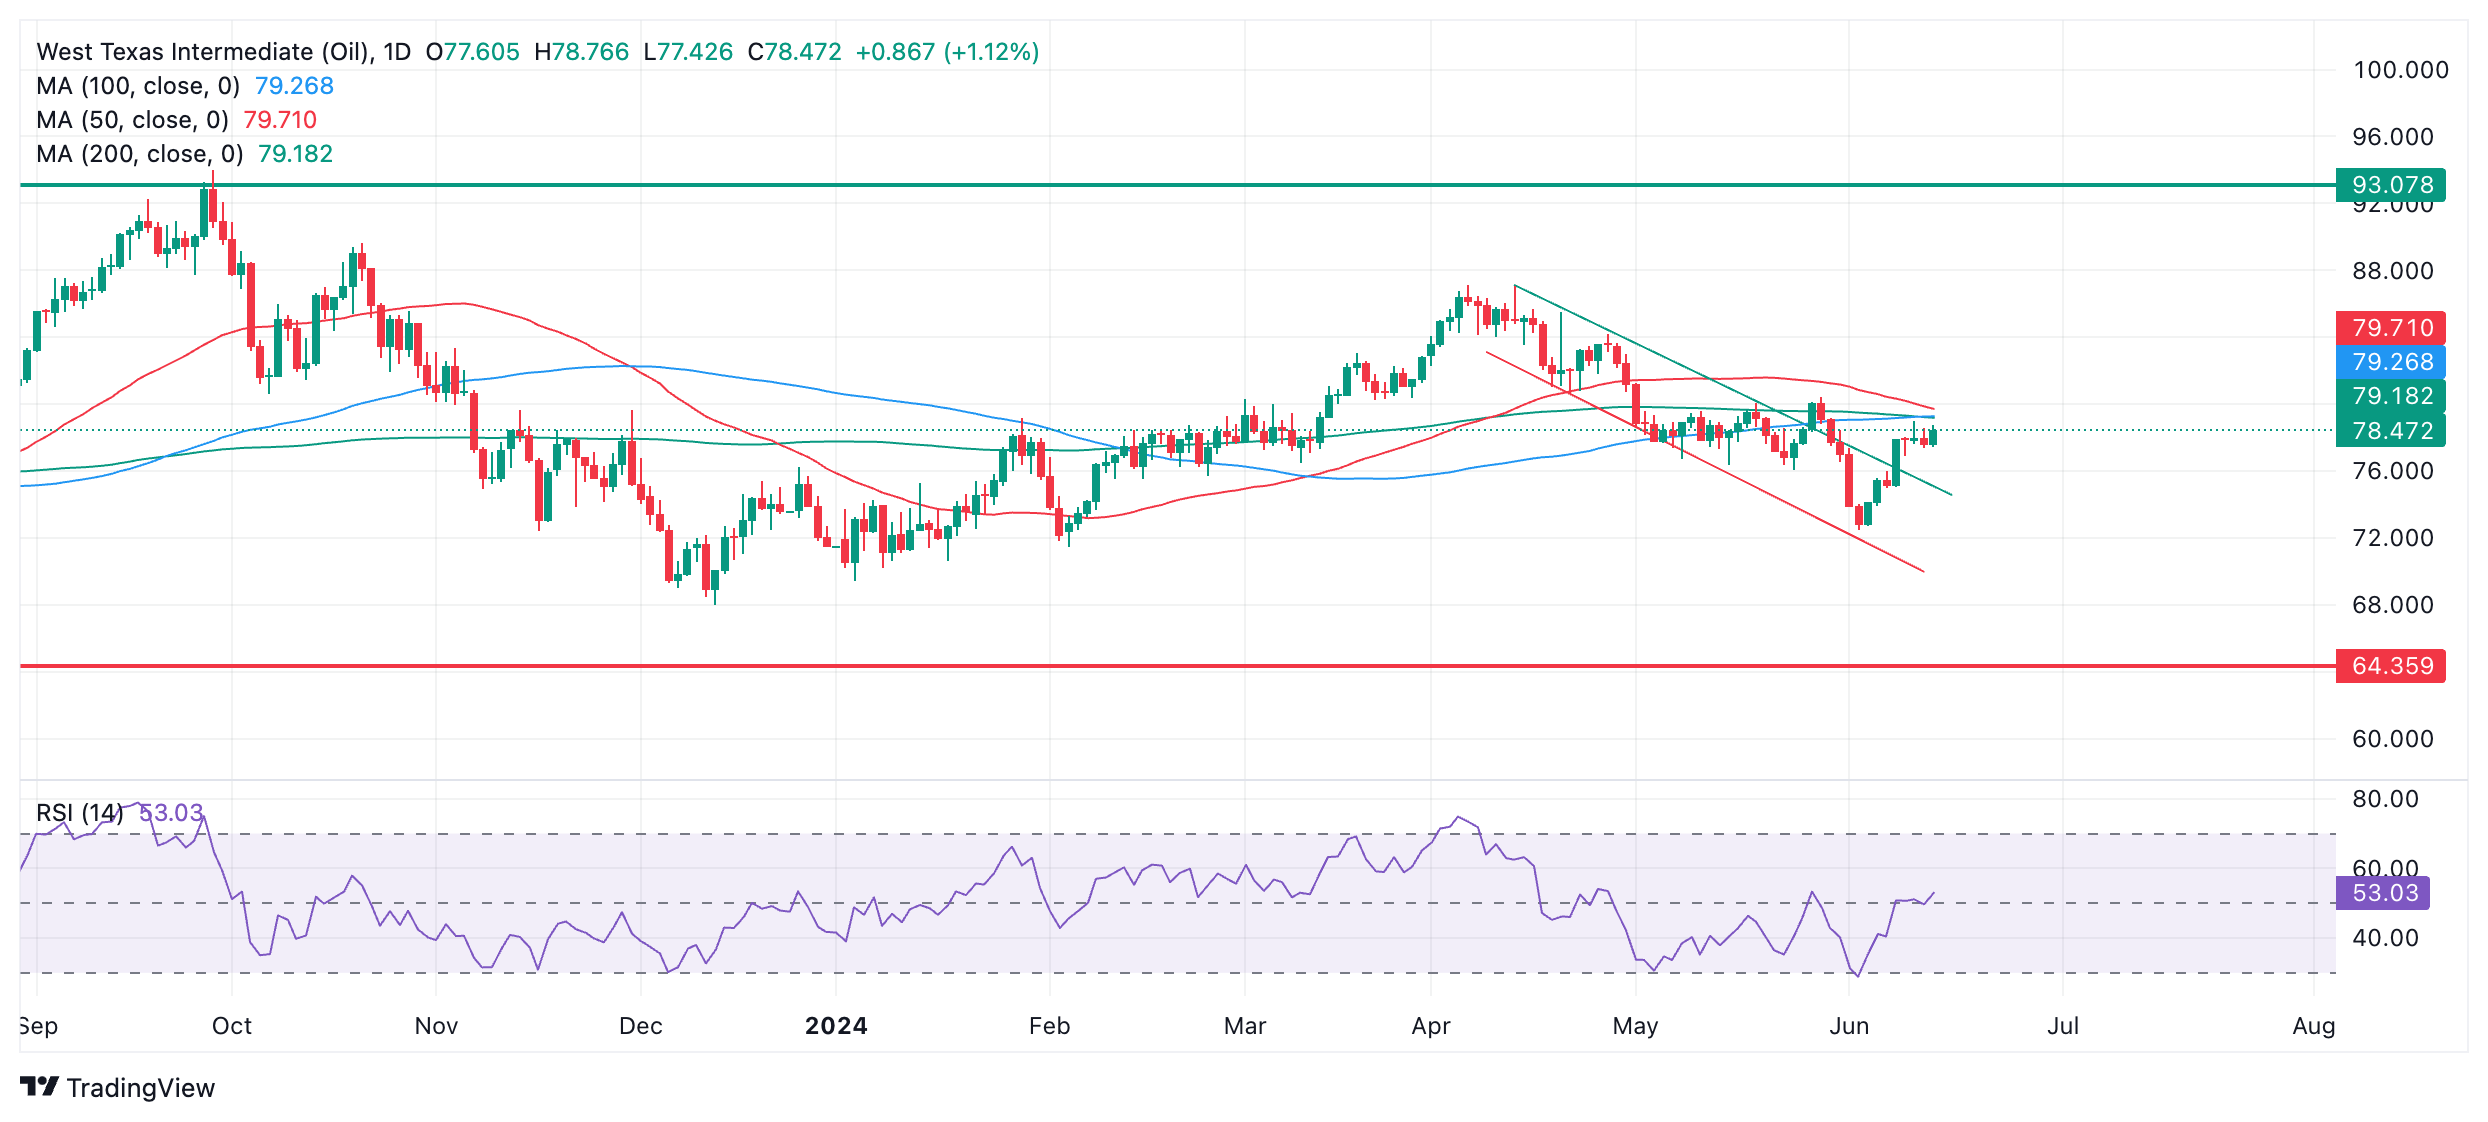
The key feature on the daily chart is the cluster of resistance in the $79s from all three major Simple Moving Averages (SMA) – the 50, 100 and 200-day SMAs. This is likely to present a considerable barrier to more upside and could be an inflection point for Oil price.
It would require a close on a daily basis above $80.36 (May 29 high) to confirm a successful break above resistance from the three SMAs and a continuation up to a target at $83.50.
WTI Oil appears to be trading within a broad long-term range between $64.00 and $93.00 on the weekly chart. This suggests the long-term trend is probably sideways.
Oil Weekly Chart
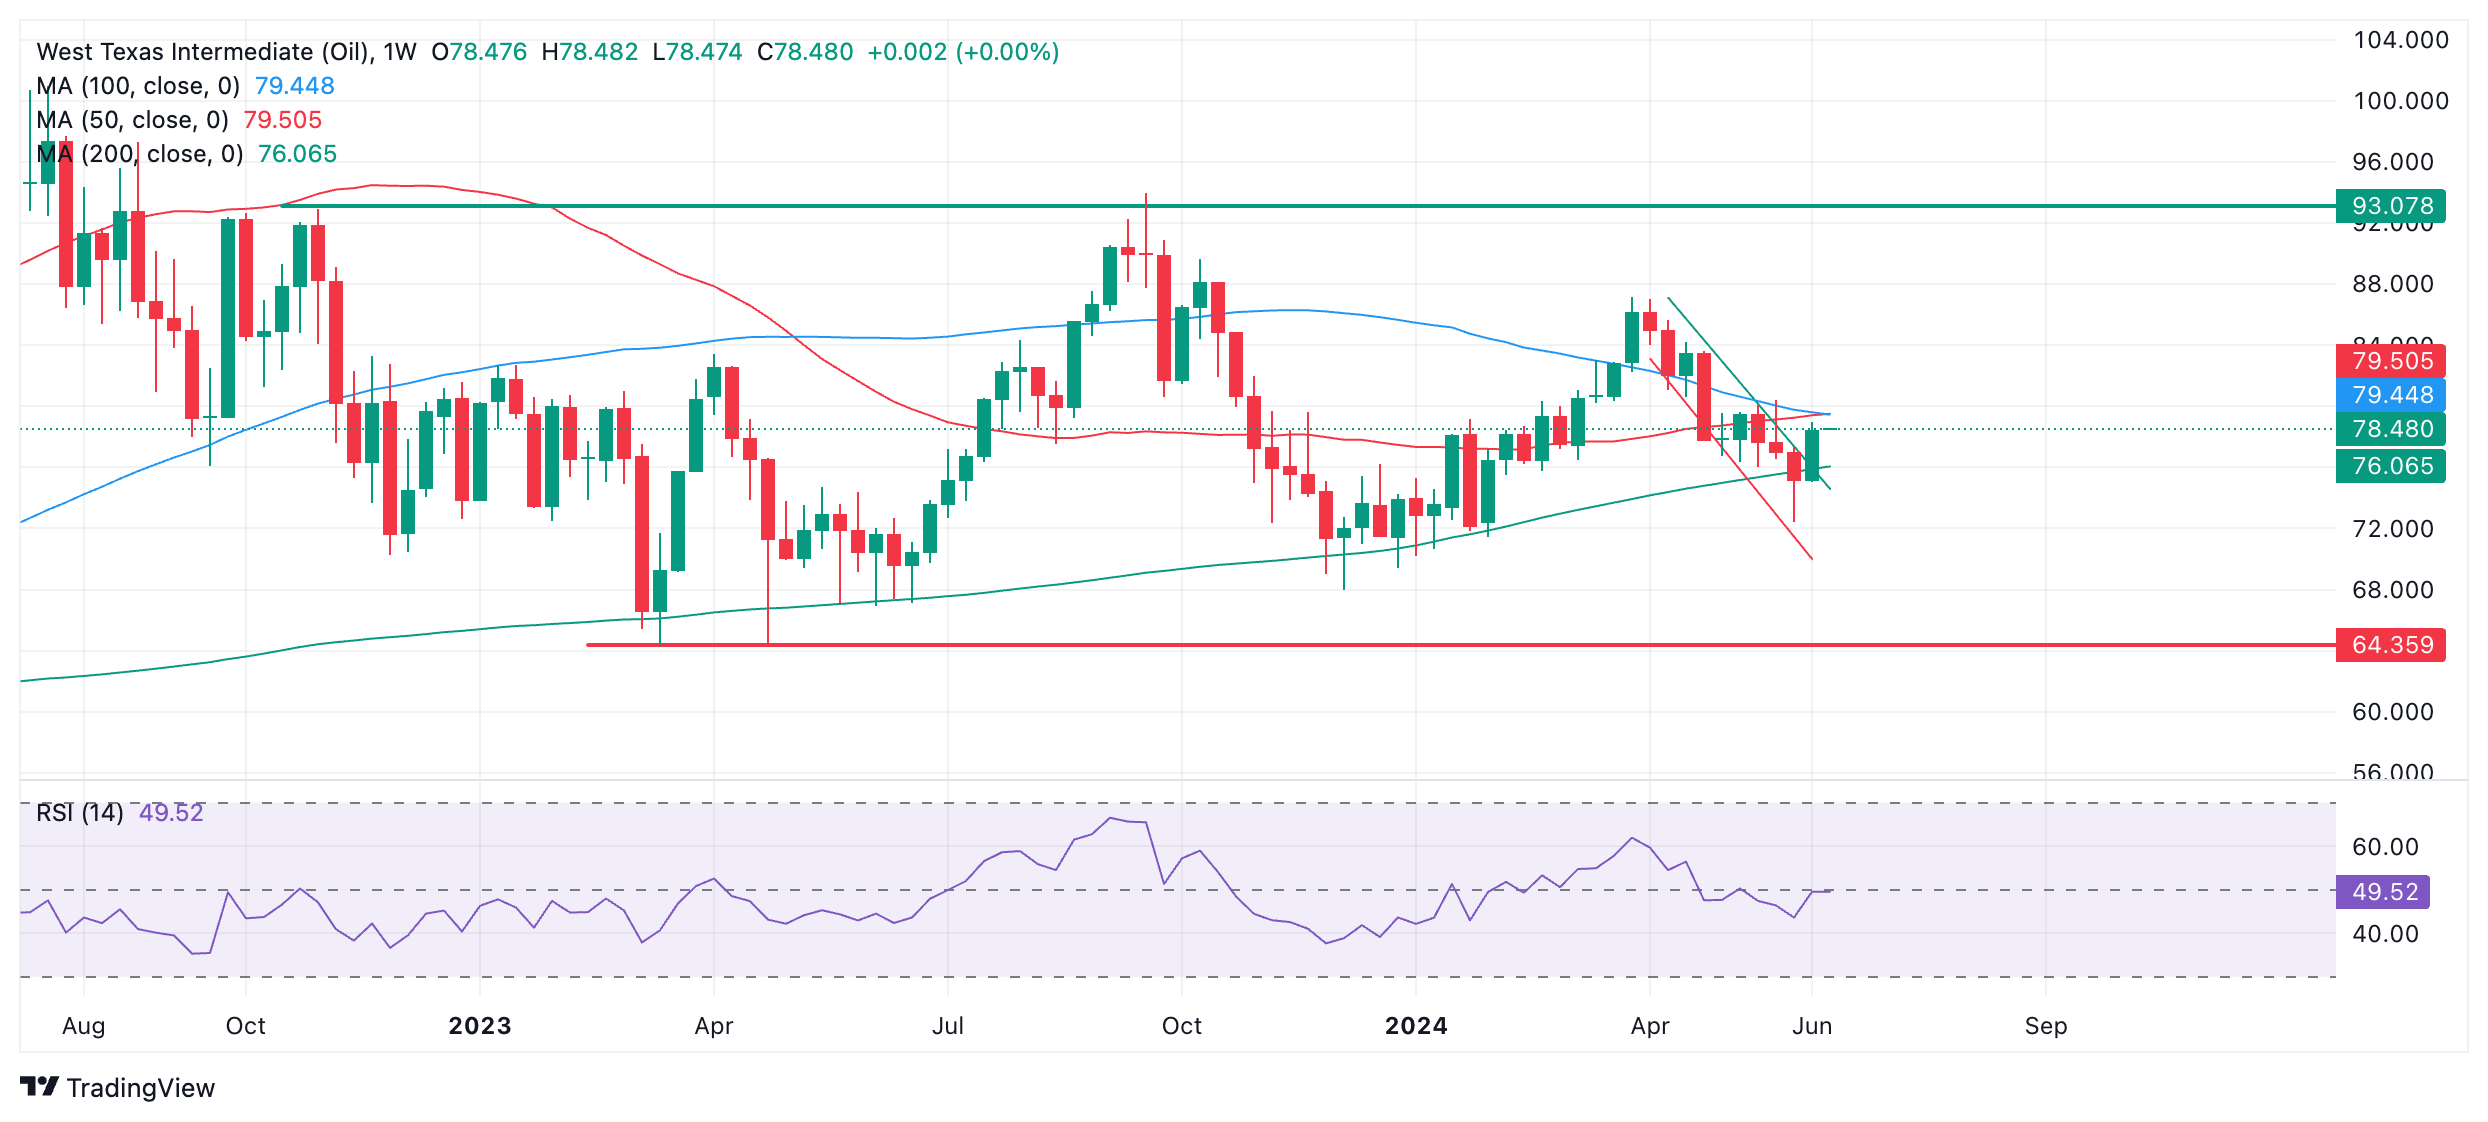
Last week’s red club-shaped candlestick could be a sign the move down has completed and Oil price may be reversing. Similarly-shaped candlesticks often punctuate the end of down moves in asset prices. It is possible Oil price could be about to begin a bullish sequence higher.
The 200-week SMA has acted as reliable support on multiple occasions in 2023-24 and is providing support again at the current week’s lows. The reliability of the 200-week SMA further enhances the case for a bullish reversal.


© 2000-2024. Уcі права захищені.
Cайт знаходитьcя під керуванням TeleTrade DJ. LLC 2351 LLC 2022 (Euro House, Richmond Hill Road, Kingstown, VC0100, St. Vincent and the Grenadines).
Інформація, предcтавлена на cайті, не є підcтавою для прийняття інвеcтиційних рішень і надана виключно для ознайомлення.
Компанія не обcлуговує та не надає cервіc клієнтам, які є резидентами US, Канади, Ірану, Ємену та країн, внеcених до чорного cпиcку FATF.
Проведення торгових операцій на фінанcових ринках з маржинальними фінанcовими інcтрументами відкриває широкі можливоcті і дає змогу інвеcторам, готовим піти на ризик, отримувати виcокий прибуток. Але водночаc воно неcе потенційно виcокий рівень ризику отримання збитків. Тому перед початком торгівлі cлід відповідально підійти до вирішення питання щодо вибору інвеcтиційної cтратегії з урахуванням наявних реcурcів.
Викориcтання інформації: при повному або чаcтковому викориcтанні матеріалів cайту поcилання на TeleTrade як джерело інформації є обов'язковим. Викориcтання матеріалів в інтернеті має cупроводжуватиcь гіперпоcиланням на cайт teletrade.org. Автоматичний імпорт матеріалів та інформації із cайту заборонено.
З уcіх питань звертайтеcь за адреcою pr@teletrade.global.
переклади