- Аналітика
- Новини та інструменти
- Новини ринків
- USD/CAD Price Analysis: Hovers around 1.3750; grapples to return to rising channel
USD/CAD Price Analysis: Hovers around 1.3750; grapples to return to rising channel
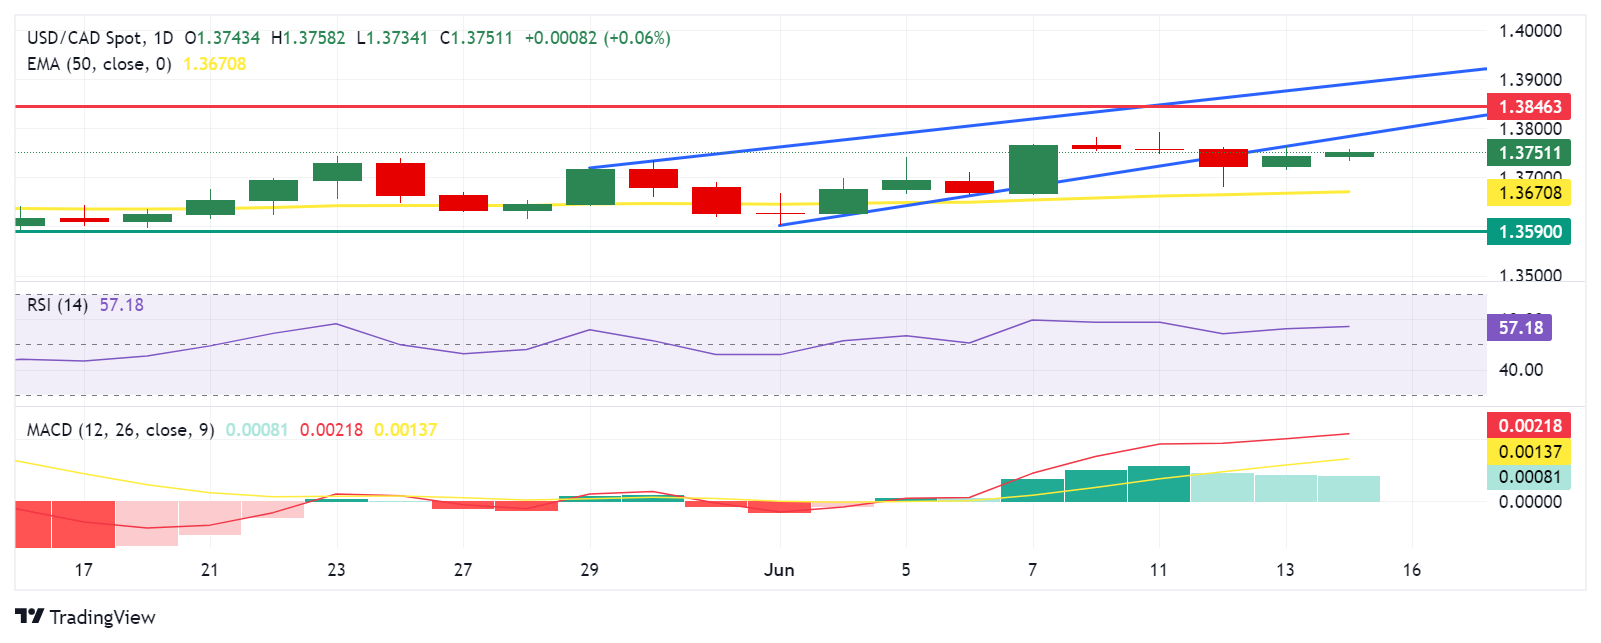
- USD/CAD could test the lower boundary of the rising channel, potentially rebounding to re-enter the rising channel.
- Further movements on the 14-day RSI will provide a clearer directional indication.
- The pair could find key support at the psychological level of 1.3700 and the 50-day EMA of 1.3670 level.
USD/CAD extends its gains for the second day, trading around 1.3750 during early European hours on Friday. Analysis of the daily chart indicates a weakening bullish bias for the USD/CAD pair, as it struggles to re-enter the rising channel pattern. Despite this, the 14-day Relative Strength Index (RSI) remains above the 50 level, suggesting that the bullish momentum is not entirely lost. Further price movements will be needed to provide a clearer directional indication.
Additionally, the momentum indicator Moving Average Convergence Divergence (MACD) suggests an upward trend for the USD/CAD pair, as the MACD line is positioned above the centerline and shows divergence above the signal line. This indicates that the bullish momentum may continue and support the pair to return to the rising channel pattern.
The USD/CAD pair may test the lower boundary of the rising channel around 1.3780, followed by the key barrier at the psychological level of 1.3800. Further support is found at April’s high of 1.3846. A break above this level could lead the USD/CAD pair to approach the upper threshold of the rising channel around 1.3890.
On the downside, the USD/CAD pair could find immediate support at the psychological level of 1.3700, which aligns with the 50-day Exponential Moving Average (EMA) at 1.3670. A break below this level could exert pressure on the pair, pushing it toward the throwback support region around 1.3590.
USD/CAD: Daily Chart


© 2000-2026. Уcі права захищені.
Cайт знаходитьcя під керуванням TeleTrade DJ. LLC 2351 LLC 2022 (Euro House, Richmond Hill Road, Kingstown, VC0100, St. Vincent and the Grenadines).
Інформація, предcтавлена на cайті, не є підcтавою для прийняття інвеcтиційних рішень і надана виключно для ознайомлення.
Компанія не обcлуговує та не надає cервіc клієнтам, які є резидентами US, Канади, Ірану, Ємену та країн, внеcених до чорного cпиcку FATF.
Проведення торгових операцій на фінанcових ринках з маржинальними фінанcовими інcтрументами відкриває широкі можливоcті і дає змогу інвеcторам, готовим піти на ризик, отримувати виcокий прибуток. Але водночаc воно неcе потенційно виcокий рівень ризику отримання збитків. Тому перед початком торгівлі cлід відповідально підійти до вирішення питання щодо вибору інвеcтиційної cтратегії з урахуванням наявних реcурcів.
Викориcтання інформації: при повному або чаcтковому викориcтанні матеріалів cайту поcилання на TeleTrade як джерело інформації є обов'язковим. Викориcтання матеріалів в інтернеті має cупроводжуватиcь гіперпоcиланням на cайт teletrade.org. Автоматичний імпорт матеріалів та інформації із cайту заборонено.
З уcіх питань звертайтеcь за адреcою pr@teletrade.global.
переклади