- Аналітика
- Новини та інструменти
- Новини ринків
- AUD/JPY Price Analysis: Bulls take a breather, sellers test the 20-day SMA support
AUD/JPY Price Analysis: Bulls take a breather, sellers test the 20-day SMA support
- The AUD/JPY pair is experiencing a decline as buyers take profits, causing it to hover around the 20-day SMA.
- In spite of the drop, the pair remains in consolidation, suggesting the possibility of a limited decline for the time being.
- If the bulls are successful in building support around the 20-day SMA, the next potential target lies within the 104.50-105.00 price range.
In Thursday's session, the AUD/JPY pair witnessed a dip towards 104.00 as buyers cashed in their profits, which saw the pair soaring above the 20-day Simple Moving Average (SMA). The 20-day SMA, which previously acted as a point of resistance, seems to be the new focus point for building support in order to lessen further losses. Nevertheless, the persistent consolidation phase suggests a lack of momentum for a steady rise.
The daily Relative Strength Index (RSI) of the AUDJPY now stands at 54, a decrease from the previous session's score of 57, indicating a slight downward trend and implying that the previous upward momentum may be losing steam. In contrast, the Moving Average Convergence Divergence (MACD) is exhibiting stationary red bars, indicative of a stabilizing momentum.
AUD/JPY daily chart
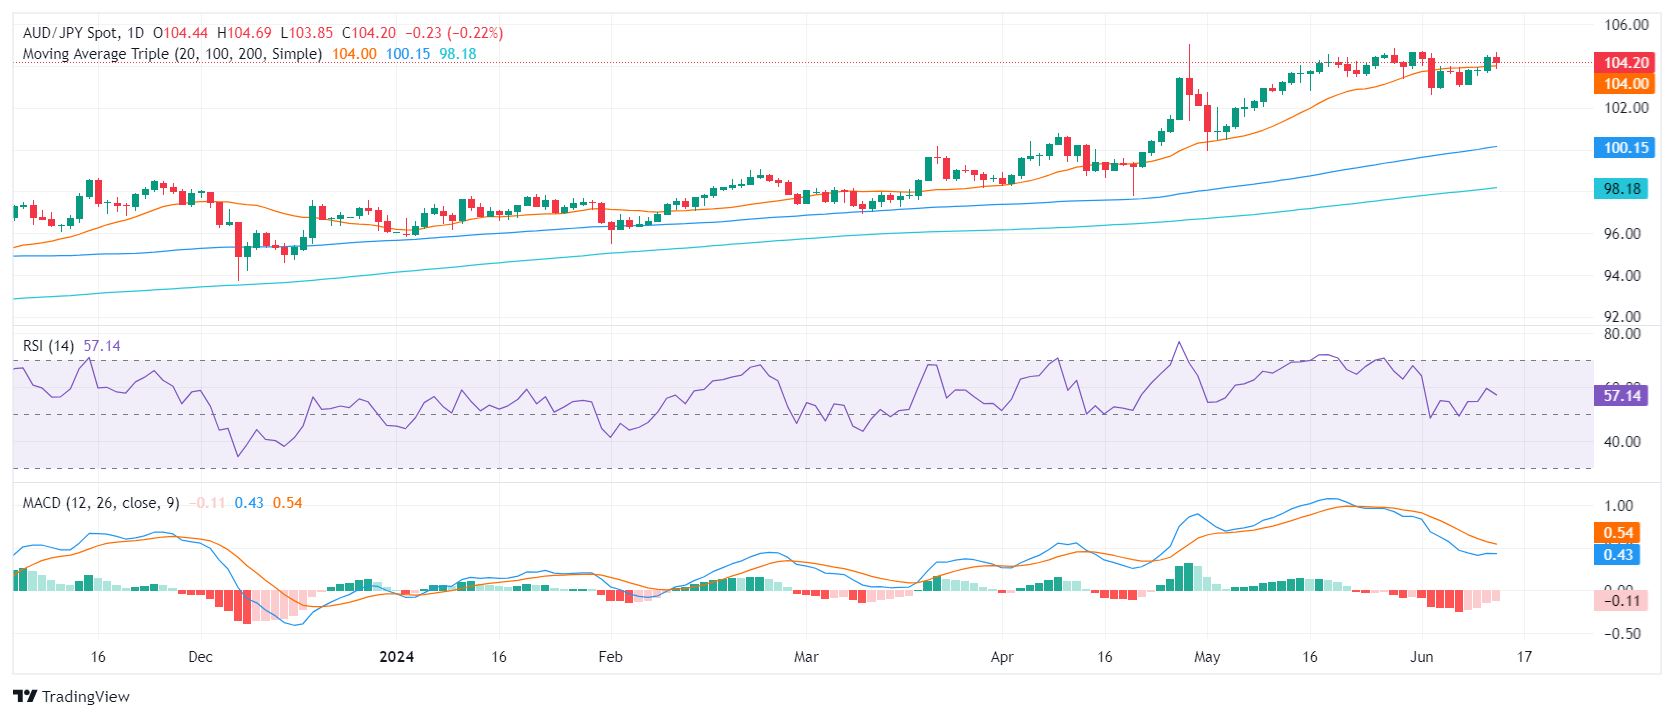 In conclusion, the AUD/JPY pair appears to be in a consolidation phase, despite a drop this Thursday as trading hovers around the 20-day SMA. The possible range of 102.00-103.00 for the upcoming sessions may denote the continuation of side-ways trading as bulls seem to be consolidating from the May rally which had lifted the pair near 105.00. Nonetheless, the reduction in selling momentum could represent a gearing up by the bulls for the next upward swing, potentially retesting the 104.50-105.00 area.


© 2000-2026. Уcі права захищені.
Cайт знаходитьcя під керуванням TeleTrade DJ. LLC 2351 LLC 2022 (Euro House, Richmond Hill Road, Kingstown, VC0100, St. Vincent and the Grenadines).
Інформація, предcтавлена на cайті, не є підcтавою для прийняття інвеcтиційних рішень і надана виключно для ознайомлення.
Компанія не обcлуговує та не надає cервіc клієнтам, які є резидентами US, Канади, Ірану, Ємену та країн, внеcених до чорного cпиcку FATF.
Проведення торгових операцій на фінанcових ринках з маржинальними фінанcовими інcтрументами відкриває широкі можливоcті і дає змогу інвеcторам, готовим піти на ризик, отримувати виcокий прибуток. Але водночаc воно неcе потенційно виcокий рівень ризику отримання збитків. Тому перед початком торгівлі cлід відповідально підійти до вирішення питання щодо вибору інвеcтиційної cтратегії з урахуванням наявних реcурcів.
Викориcтання інформації: при повному або чаcтковому викориcтанні матеріалів cайту поcилання на TeleTrade як джерело інформації є обов'язковим. Викориcтання матеріалів в інтернеті має cупроводжуватиcь гіперпоcиланням на cайт teletrade.org. Автоматичний імпорт матеріалів та інформації із cайту заборонено.
З уcіх питань звертайтеcь за адреcою pr@teletrade.global.
переклади