- Аналітика
- Новини та інструменти
- Новини ринків
- NZD/JPY Price Analysis: Cross reached multi-year highs, upside appears limited
NZD/JPY Price Analysis: Cross reached multi-year highs, upside appears limited
- Kiwi shows signs of fatigue against the Yen, after reaching highest level since June 2007 on Thursday.
- Indicators on the daily chart suggest potential further consolidation, with trading confined between 95.00 and 97.00.
- A retest of the 97.00 level is possible, but a breach is unlikely as buyers consolidate gains from the significant ascent in May.
On Thursday, the NZD/JPY pair exhibited signs of fatigue, following its advancement to the multi-year highs logged earlier in the week. Clearly, the technical landscape suggests an extension of the consolidation phase, potentially keeping the pair's upside movements capped below the psychological 97.00 level.
The daily Relative Strength Index (RSI) for NZD/JPY has slightly retreated to 59, indicative of a waning in the bullish momentum. The Moving Average Convergence Divergence (MACD) continues to print flat red bars, further endorsing the perspective of ongoing consolidation.
NZD/JPY daily chart
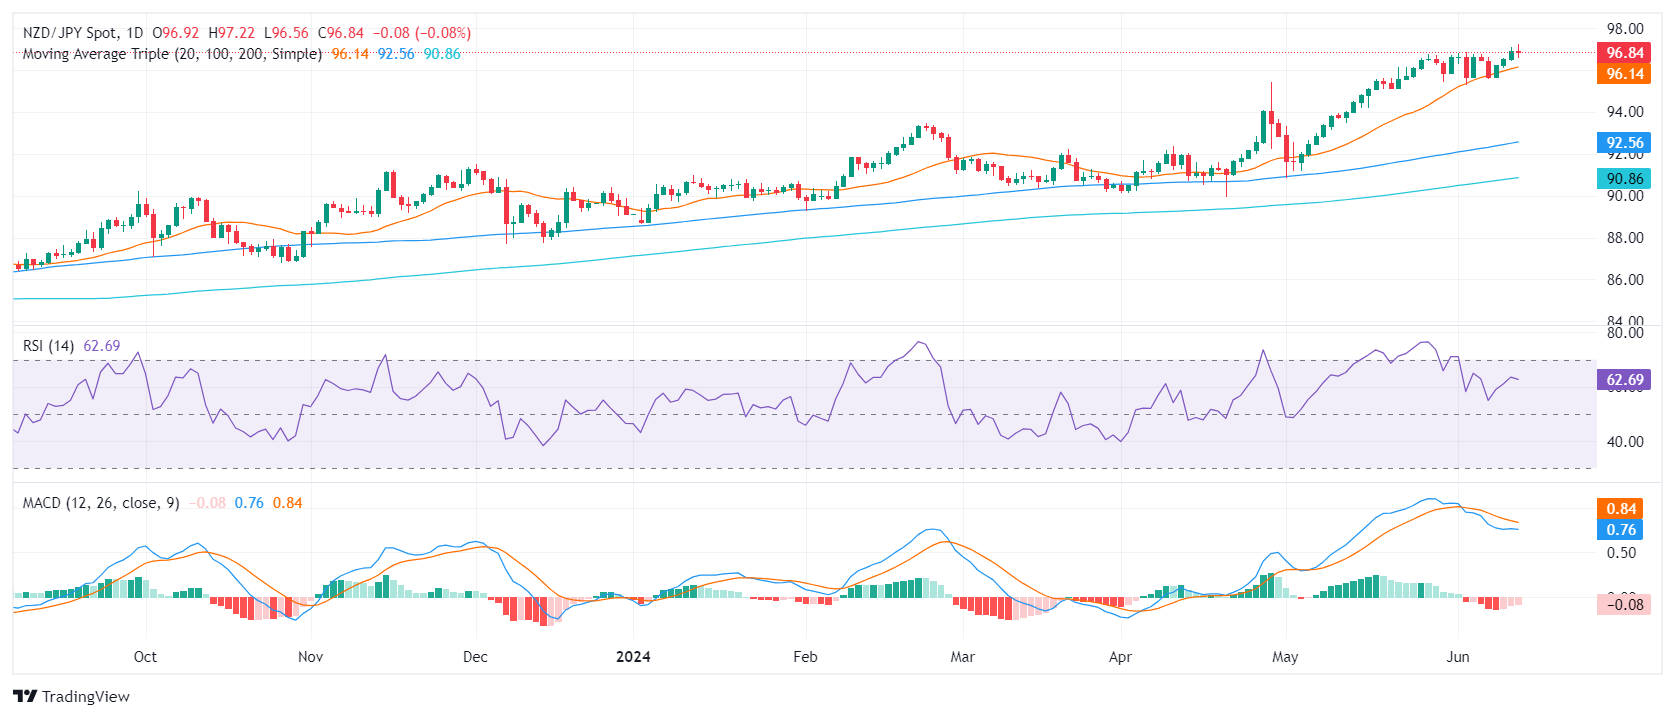 The continuous presence of buyers above the 20-day Simple Moving Average (SMA) indicates their effort to sustain the bullish push. Yet, the recent exhaustion signal demonstrated by the daily technical indicators supports the market's need to consolidate following the significant surge recorded in May. The upcoming trading sessions might see the pair oscillate between the 95.00 level, serving as support, and the 97.00 level, acting as resistance, as the pair looks to stabilize after recent gains.
The longer-term SMAs established around 90.00 - 92.00 safeguard the overall bullish complexion of the pair.


© 2000-2026. Уcі права захищені.
Cайт знаходитьcя під керуванням TeleTrade DJ. LLC 2351 LLC 2022 (Euro House, Richmond Hill Road, Kingstown, VC0100, St. Vincent and the Grenadines).
Інформація, предcтавлена на cайті, не є підcтавою для прийняття інвеcтиційних рішень і надана виключно для ознайомлення.
Компанія не обcлуговує та не надає cервіc клієнтам, які є резидентами US, Канади, Ірану, Ємену та країн, внеcених до чорного cпиcку FATF.
Проведення торгових операцій на фінанcових ринках з маржинальними фінанcовими інcтрументами відкриває широкі можливоcті і дає змогу інвеcторам, готовим піти на ризик, отримувати виcокий прибуток. Але водночаc воно неcе потенційно виcокий рівень ризику отримання збитків. Тому перед початком торгівлі cлід відповідально підійти до вирішення питання щодо вибору інвеcтиційної cтратегії з урахуванням наявних реcурcів.
Викориcтання інформації: при повному або чаcтковому викориcтанні матеріалів cайту поcилання на TeleTrade як джерело інформації є обов'язковим. Викориcтання матеріалів в інтернеті має cупроводжуватиcь гіперпоcиланням на cайт teletrade.org. Автоматичний імпорт матеріалів та інформації із cайту заборонено.
З уcіх питань звертайтеcь за адреcою pr@teletrade.global.
переклади