- Аналітика
- Новини та інструменти
- Новини ринків
- AUD/JPY Price Analysis: Positive momentum stirs, 103.00 supports hold firm
AUD/JPY Price Analysis: Positive momentum stirs, 103.00 supports hold firm
- Daily chart indicators reveal a slight recovery from the latest bearish movements of the pair.
- Signs of a bullish pivot are emerging, intimating a potential decrease in bearish pressure or a hiccup in the consolidation phase.
- The pair contacts the crucial 20-day SMA at 103.90, which recently began to act as a resistance.
On Monday, the AUD/JPY pair showed signs of stabilizing and rebounded to 103.80, near the 20-day Simple Moving Average (SMA). This could indicate a potential easing of the downward momentum that followed last week's consolidation phase.
Turning attention to the daily Relative Strength Index (RSI) analysis, the index currently stands at 52. Compared to earlier readings, a notable increase suggests the pair's momentum may have taken a bullish turn in the near term. Furthermore, the Moving Average Convergence Divergence (MACD) continues to chart flat red bars, indicating a flattening negative momentum.
AUD/JPY daily chart
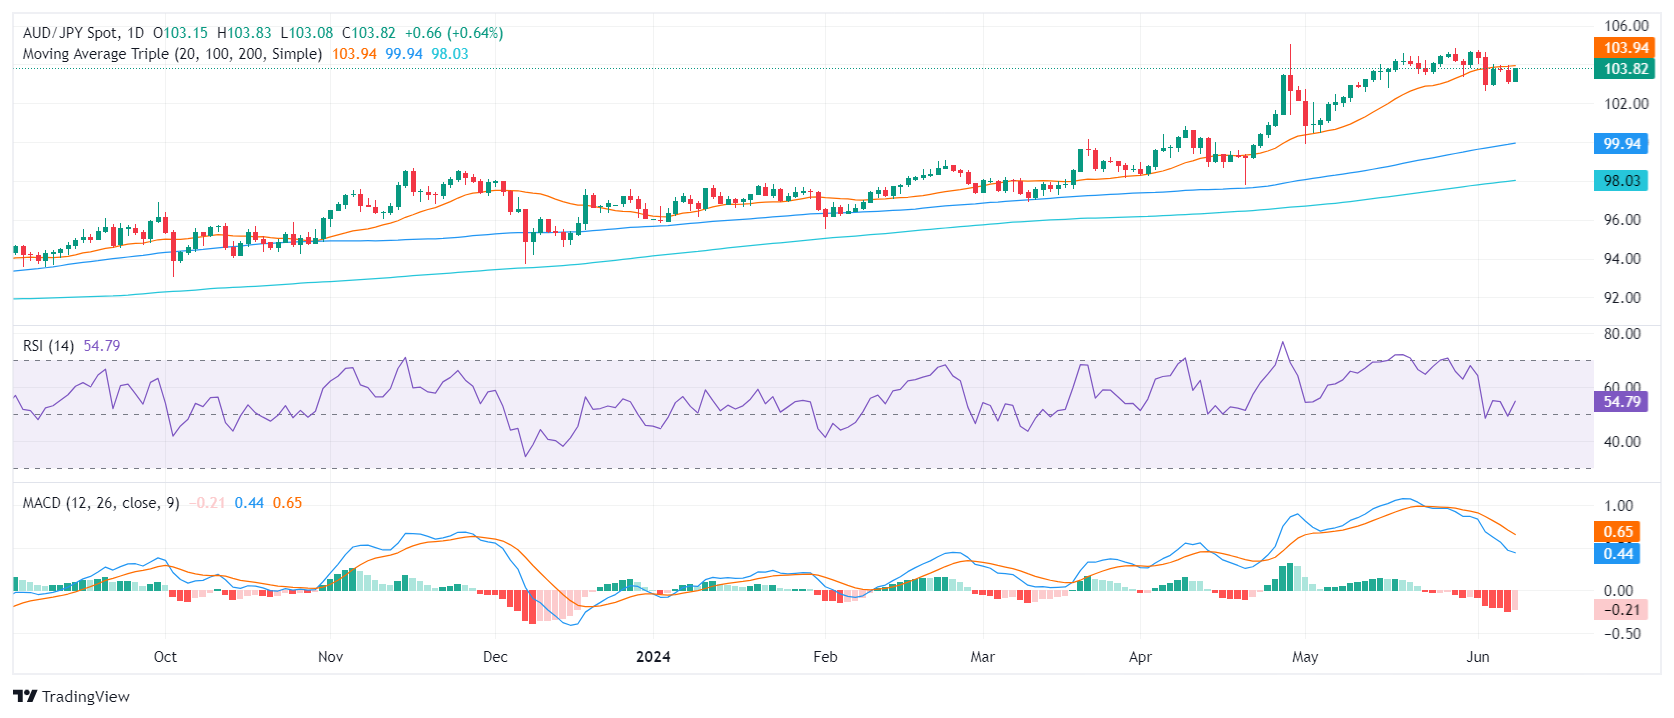
If the pair succumbs to further losses, the 100 and 200-day SMAs provide solid support platforms at around 99.80 and 97.98 respectively. If a bullish reaction propels the pair above the currently challenging 20-day SMA at 103.90, and towards the 105.00 level, significant resistance is to be expected. However, if these resistance barriers hold firm, the AUD/JPY pair may prolong its consolidation stage.
In conclusion, the AUD/JPY pair has encountered strong support at 103.00, indicated by its recent recovery to 103.80 on Monday. This could suggest a potential easing of the bearish pressure unless the pair is able to break through the 20-day SMA of 103.90.


© 2000-2026. Уcі права захищені.
Cайт знаходитьcя під керуванням TeleTrade DJ. LLC 2351 LLC 2022 (Euro House, Richmond Hill Road, Kingstown, VC0100, St. Vincent and the Grenadines).
Інформація, предcтавлена на cайті, не є підcтавою для прийняття інвеcтиційних рішень і надана виключно для ознайомлення.
Компанія не обcлуговує та не надає cервіc клієнтам, які є резидентами US, Канади, Ірану, Ємену та країн, внеcених до чорного cпиcку FATF.
Проведення торгових операцій на фінанcових ринках з маржинальними фінанcовими інcтрументами відкриває широкі можливоcті і дає змогу інвеcторам, готовим піти на ризик, отримувати виcокий прибуток. Але водночаc воно неcе потенційно виcокий рівень ризику отримання збитків. Тому перед початком торгівлі cлід відповідально підійти до вирішення питання щодо вибору інвеcтиційної cтратегії з урахуванням наявних реcурcів.
Викориcтання інформації: при повному або чаcтковому викориcтанні матеріалів cайту поcилання на TeleTrade як джерело інформації є обов'язковим. Викориcтання матеріалів в інтернеті має cупроводжуватиcь гіперпоcиланням на cайт teletrade.org. Автоматичний імпорт матеріалів та інформації із cайту заборонено.
З уcіх питань звертайтеcь за адреcою pr@teletrade.global.
переклади