- Аналітика
- Новини та інструменти
- Новини ринків
- EUR/JPY Price Analysis: Support holds strong at 168.00 and clears losses
EUR/JPY Price Analysis: Support holds strong at 168.00 and clears losses
- The daily RSI remains settled in the negative territory, with the daily MACD displaying flat red bars reflecting stable bearish momentum.
- The pair finds steady support near 168.00, stabilizing at 168.80 beyond the session's low at 168.15.
- The prevalent bullish trend is sustained by the fortitude of the 100- and 200-day SMAs.
On Monday, the EUR/JPY pair experienced an initial fall to 168.15 before stabilizing at 168.80, which seems to affirm the fortification of the support level around 168.00. Although an effort to recover the short-term 20-day SMA is needed to avert further descent, the 168.00 barrier would likely act as a fallback for the bulls if market pressure intensifies.
The Relative Strength Index (RSI) on the daily chart now reads 47, preserving its position in the negative area, which implies a slightly bearish market disposition. The daily Moving Average Convergence Divergence (MACD) retains flat red bars, marking a steady bearish momentum. This could perhaps signal a consolidation phase prior to any substantial shifts.
EUR/JPY daily chart
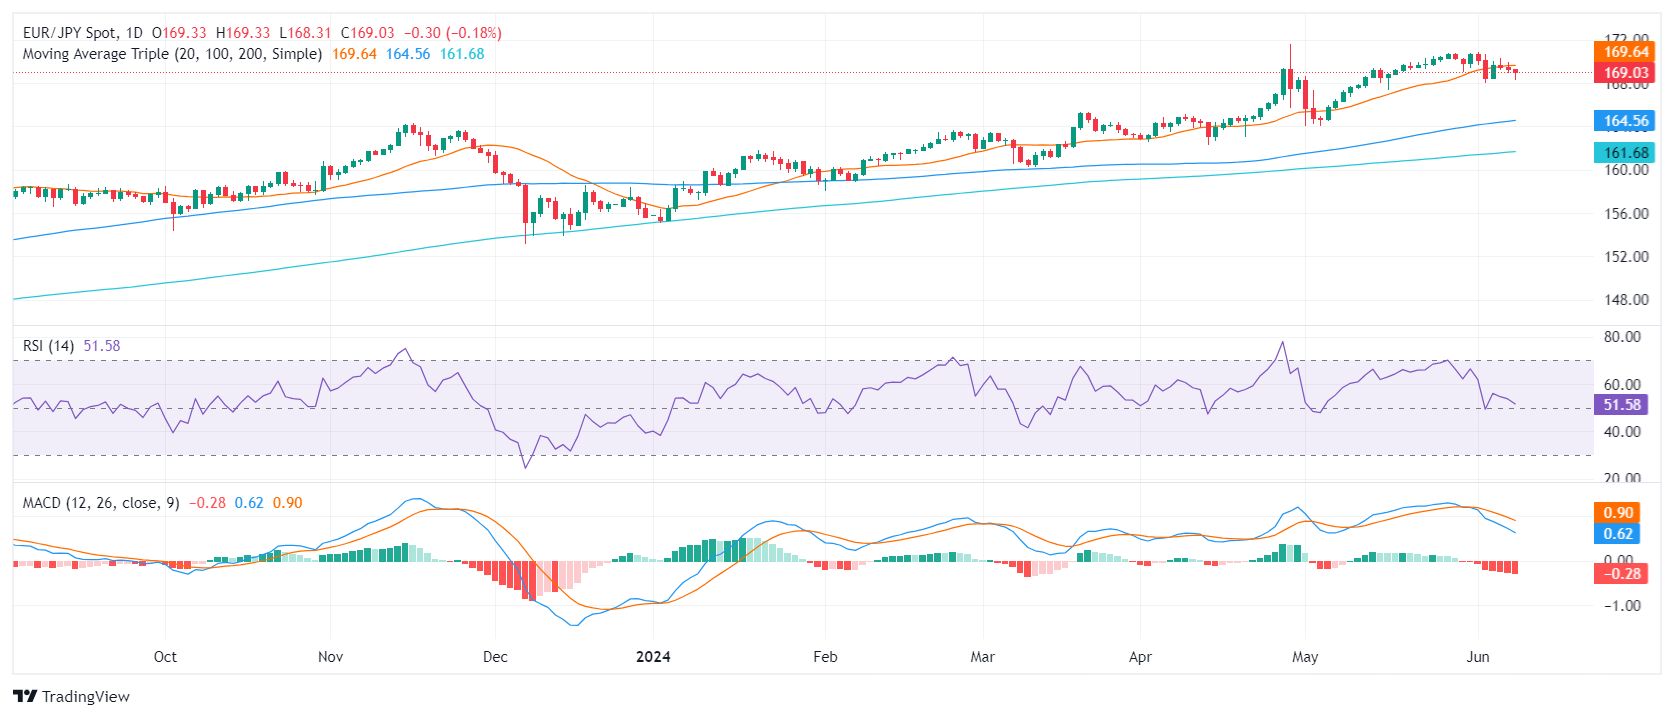
On the other hand, the broader bullish tendency in the EUR/JPY persists. The robust support rendered by the 100- and 200-day Simple Moving Averages (SMAs), located around 164.00 and 161.00 correspondingly, remains a strong fortification against extensive bearish movements. Hence, despite the mild bearish undertones of recent sessions, these fluctuations are possibly corrective rather than indicative of any sweeping alterations in the prevailing trend.


© 2000-2026. Уcі права захищені.
Cайт знаходитьcя під керуванням TeleTrade DJ. LLC 2351 LLC 2022 (Euro House, Richmond Hill Road, Kingstown, VC0100, St. Vincent and the Grenadines).
Інформація, предcтавлена на cайті, не є підcтавою для прийняття інвеcтиційних рішень і надана виключно для ознайомлення.
Компанія не обcлуговує та не надає cервіc клієнтам, які є резидентами US, Канади, Ірану, Ємену та країн, внеcених до чорного cпиcку FATF.
Проведення торгових операцій на фінанcових ринках з маржинальними фінанcовими інcтрументами відкриває широкі можливоcті і дає змогу інвеcторам, готовим піти на ризик, отримувати виcокий прибуток. Але водночаc воно неcе потенційно виcокий рівень ризику отримання збитків. Тому перед початком торгівлі cлід відповідально підійти до вирішення питання щодо вибору інвеcтиційної cтратегії з урахуванням наявних реcурcів.
Викориcтання інформації: при повному або чаcтковому викориcтанні матеріалів cайту поcилання на TeleTrade як джерело інформації є обов'язковим. Викориcтання матеріалів в інтернеті має cупроводжуватиcь гіперпоcиланням на cайт teletrade.org. Автоматичний імпорт матеріалів та інформації із cайту заборонено.
З уcіх питань звертайтеcь за адреcою pr@teletrade.global.
переклади