- Аналітика
- Новини та інструменти
- Новини ринків
- USD/CAD Price Analysis: Hovers above 1.3750, barrier at upper boundary of the channel
USD/CAD Price Analysis: Hovers above 1.3750, barrier at upper boundary of the channel
- USD/CAD could test the upper boundary of the rising channel around the level of 1.3775.
- The momentum indicator 14-day RSI suggests an emergence of a bullish bias.
- A break below the 21-day EMA could lead the pair to test the lower threshold of the rising channel around the level of 1.3640.
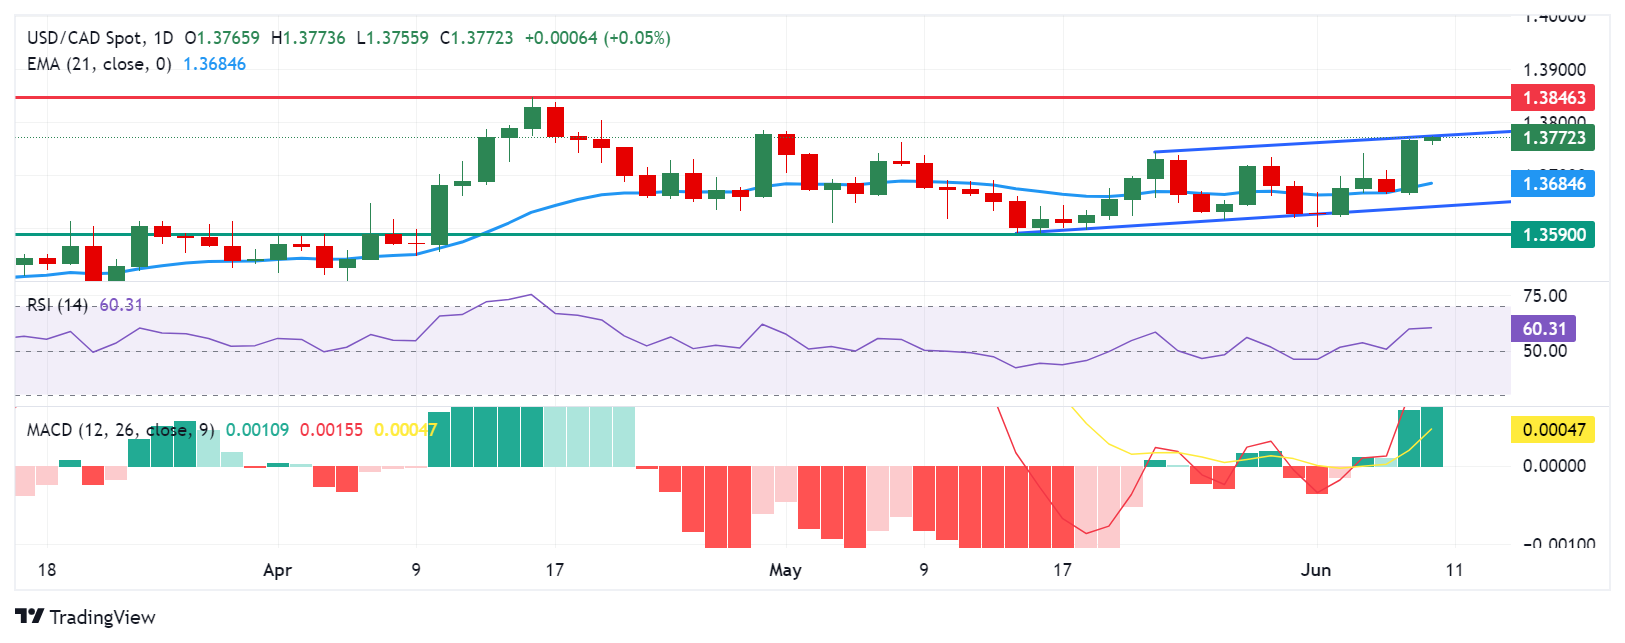
USD/CAD holds its position around 1.3760 during the early European session on Monday following the recent gains recorded in the previous trading day. Analysis of the daily chart suggests an emergence of a bullish bias for the USD/CAD pair, as it moves within the rising channel pattern.
Moreover, the momentum indicator 14-day Relative Strength Index (RSI) is positioned above the 50 level. The Moving Average Convergence Divergence (MACD) indicator suggests a confirmation of the bullish bias for the pair as the MACD line is positioned above the centerline, it shows divergence above the signal line.
The USD/CAD pair tests the upper boundary of the rising channel around the level of 1.3775, followed by the key barrier at the psychological level of 1.3800. A breakthrough above the latter level could provide support for the pair to explore the region April’s high of 1.3846.
On the downside, the USD/CAD pair could find key support around the 21-day Exponential Moving Average (EMA) of 1.3684 level. A break below this level could exert pressure on the pair to navigate the region around the lower threshold of the rising channel around the level of 1.3640, followed by the throwback support at 1.3590.
USD/CAD: Daily Chart


© 2000-2026. Уcі права захищені.
Cайт знаходитьcя під керуванням TeleTrade DJ. LLC 2351 LLC 2022 (Euro House, Richmond Hill Road, Kingstown, VC0100, St. Vincent and the Grenadines).
Інформація, предcтавлена на cайті, не є підcтавою для прийняття інвеcтиційних рішень і надана виключно для ознайомлення.
Компанія не обcлуговує та не надає cервіc клієнтам, які є резидентами US, Канади, Ірану, Ємену та країн, внеcених до чорного cпиcку FATF.
Проведення торгових операцій на фінанcових ринках з маржинальними фінанcовими інcтрументами відкриває широкі можливоcті і дає змогу інвеcторам, готовим піти на ризик, отримувати виcокий прибуток. Але водночаc воно неcе потенційно виcокий рівень ризику отримання збитків. Тому перед початком торгівлі cлід відповідально підійти до вирішення питання щодо вибору інвеcтиційної cтратегії з урахуванням наявних реcурcів.
Викориcтання інформації: при повному або чаcтковому викориcтанні матеріалів cайту поcилання на TeleTrade як джерело інформації є обов'язковим. Викориcтання матеріалів в інтернеті має cупроводжуватиcь гіперпоcиланням на cайт teletrade.org. Автоматичний імпорт матеріалів та інформації із cайту заборонено.
З уcіх питань звертайтеcь за адреcою pr@teletrade.global.
переклади