- Аналітика
- Новини та інструменти
- Новини ринків
- GBP/USD Price Analysis: The potential support level is located above 1.2700
GBP/USD Price Analysis: The potential support level is located above 1.2700
- GBP/USD struggles to gain ground around 1.2715 in Monday’s early European session.
- The pair keeps the negative vibe below the 100-period EMA, with bearish RSI indicator on the 4-hour chart.
- The first downside target is seen in the 1.2700–1.2701 zone; the next upside barrier is located at 1.2795.
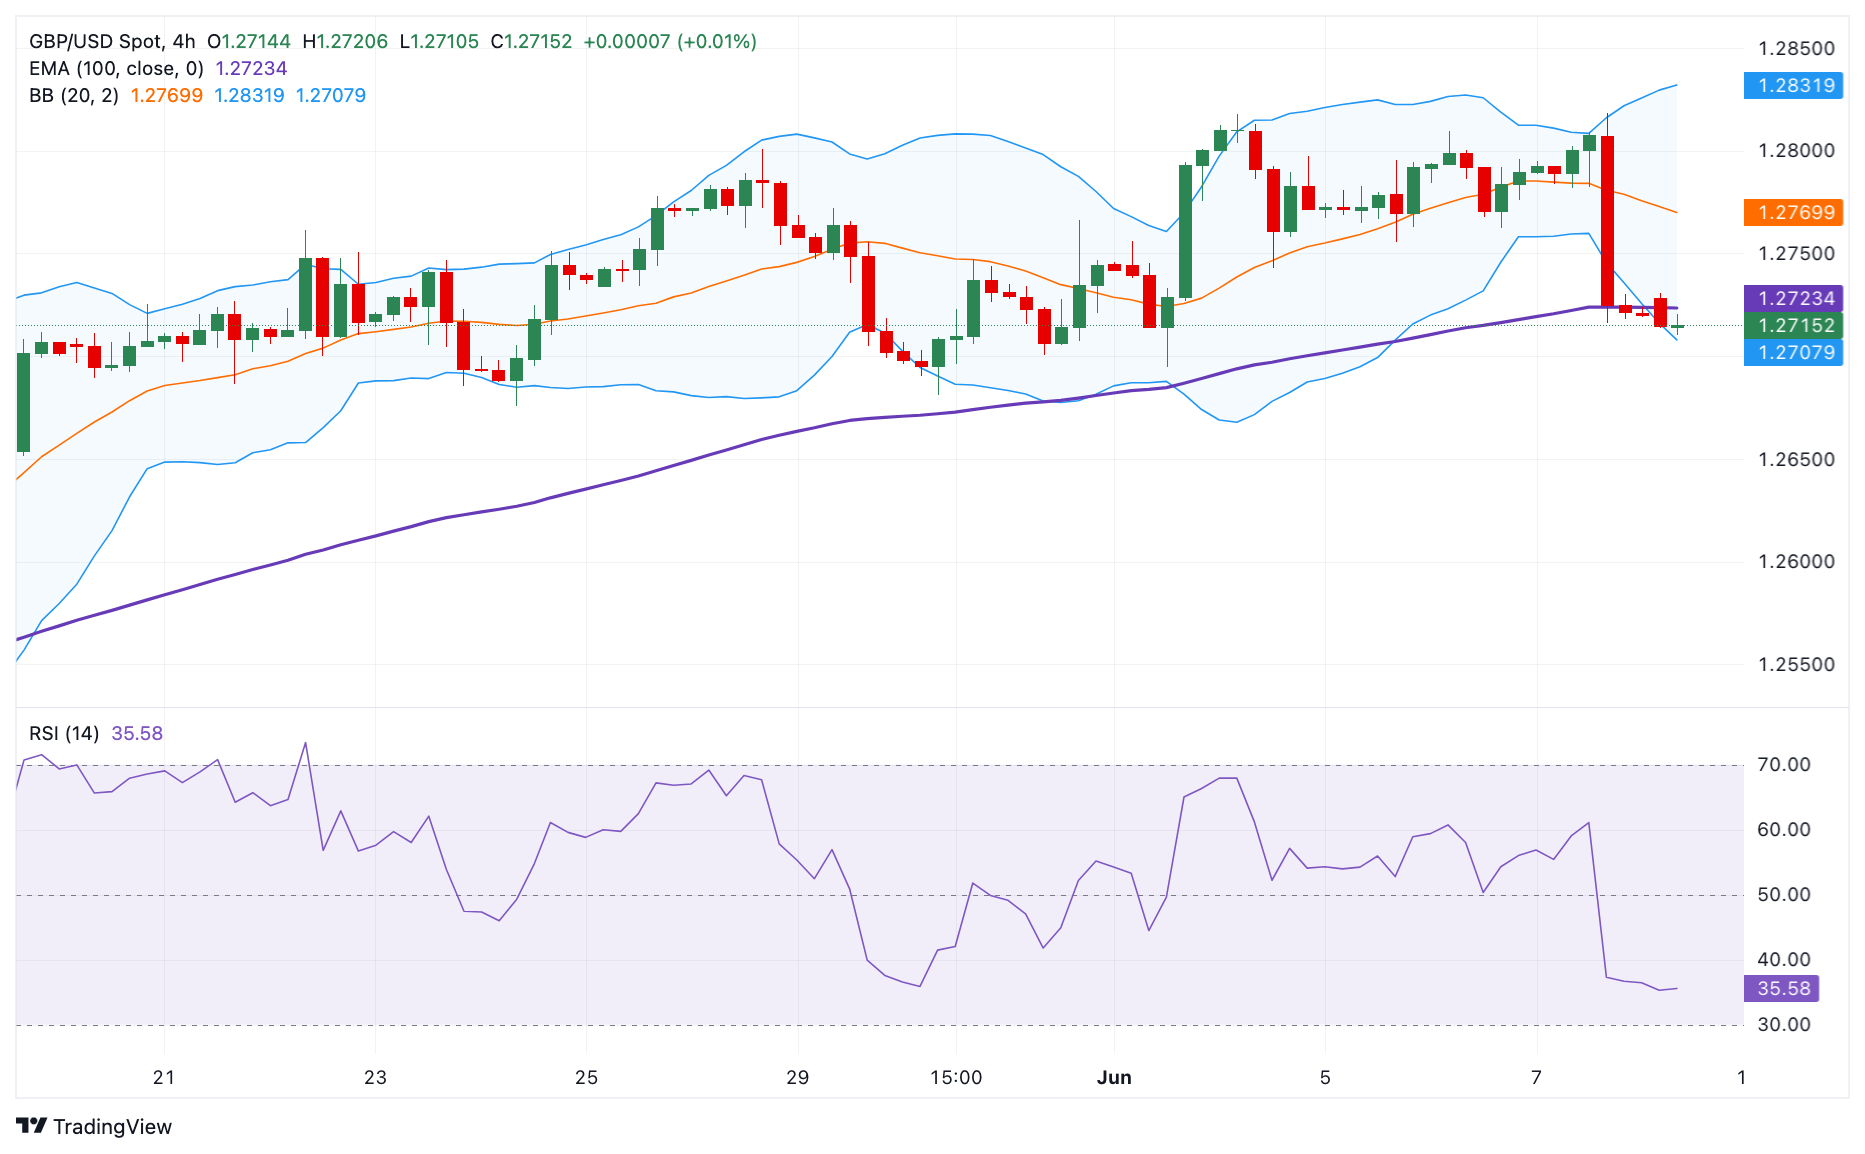
The GBP/USD pair trades in negative territory for the second consecutive day near 1.2715 during the early European session on Monday. The stronger US Dollar (USD) broadly drags the major pair lower. Investors await the UK Employment data on Tuesday for fresh impetus, including Claimant Count Change, Employment Change, and Average Earnings data. Any evidence of more layoffs in the UK economy might trigger the expectations of early rate cuts from the Bank of England (BoE) and might weigh on the Pound Sterling (GBP).
According to the 4-hour chart, the outlook of GBP/USD turns bearish as it holds below the key 100-period Exponential Moving Average (EMA). The downward momentum is supported by the Relative Strength Index (RSI), which stands around 37.00, indicating the path of least resistance is to the downside.
A decisive break below the lower limit of the Bollinger Band and psychological level at the 1.2700-1.2710 region will pave the way to 1.2681, a low of May 30. Further south, the next contention level is seen at 1.2645, a low of May 17, followed by the 1.2600 round mark.
The major pair should resume the upside if it crosses above the 100-period EMA at 1.2723. The next upside barrier for GBP/USD will emerge at 1.2795, a low of June 5. Any follow-through buying will expose 1.2809, a high of June 6, and finally the upper boundary of the Bollinger Band at 1.2831.
GBP/USD 4-hour chart


© 2000-2026. Уcі права захищені.
Cайт знаходитьcя під керуванням TeleTrade DJ. LLC 2351 LLC 2022 (Euro House, Richmond Hill Road, Kingstown, VC0100, St. Vincent and the Grenadines).
Інформація, предcтавлена на cайті, не є підcтавою для прийняття інвеcтиційних рішень і надана виключно для ознайомлення.
Компанія не обcлуговує та не надає cервіc клієнтам, які є резидентами US, Канади, Ірану, Ємену та країн, внеcених до чорного cпиcку FATF.
Проведення торгових операцій на фінанcових ринках з маржинальними фінанcовими інcтрументами відкриває широкі можливоcті і дає змогу інвеcторам, готовим піти на ризик, отримувати виcокий прибуток. Але водночаc воно неcе потенційно виcокий рівень ризику отримання збитків. Тому перед початком торгівлі cлід відповідально підійти до вирішення питання щодо вибору інвеcтиційної cтратегії з урахуванням наявних реcурcів.
Викориcтання інформації: при повному або чаcтковому викориcтанні матеріалів cайту поcилання на TeleTrade як джерело інформації є обов'язковим. Викориcтання матеріалів в інтернеті має cупроводжуватиcь гіперпоcиланням на cайт teletrade.org. Автоматичний імпорт матеріалів та інформації із cайту заборонено.
З уcіх питань звертайтеcь за адреcою pr@teletrade.global.
переклади