- Аналітика
- Новини та інструменти
- Новини ринків
- EUR/JPY Price Analysis: Bulls fight to hold the 20-day SMA, bears steady
EUR/JPY Price Analysis: Bulls fight to hold the 20-day SMA, bears steady
- The daily RSI records a balanced reading at 50, while the MACD bears a bearish crossover.
- The pair stabilize near the 20-day SMA, with buyers trying to avoid losses beneath it.
- The underlying bullish trend remains intact, guarded by the 100- and 200-day SMAs.
In Friday's session, the EUR/JPY pair is seen consolidating after a significant upward wave which took it near multi-year highs around 171.00, oscillating around the crucial 169.00 level. The stabilization at this junction is particularly corroborated by the proximity to the 20-day Simple Moving Average (SMA) near 169.60 which despite falling beneath, the cross will try to defend it as it serves as a strong support.
The Relative Strength Index (RSI) on the daily chart reads a steady 53 now, reflecting balanced market sentiment between the buyers and the sellers. This neutral RSI implies that the market participants are currently eagle-eyeing further direction before making a move. The daily Moving Average Convergence Divergence (MACD) has recently registered a bearish crossover- an occurrence when the MACD line dived under the signal line. This crossover potentially signals ensuing short-term bearish pressure, opening up possibilities of a tempo correction or further consolidation before resuming the upward march.
EUR/JPY daily chart
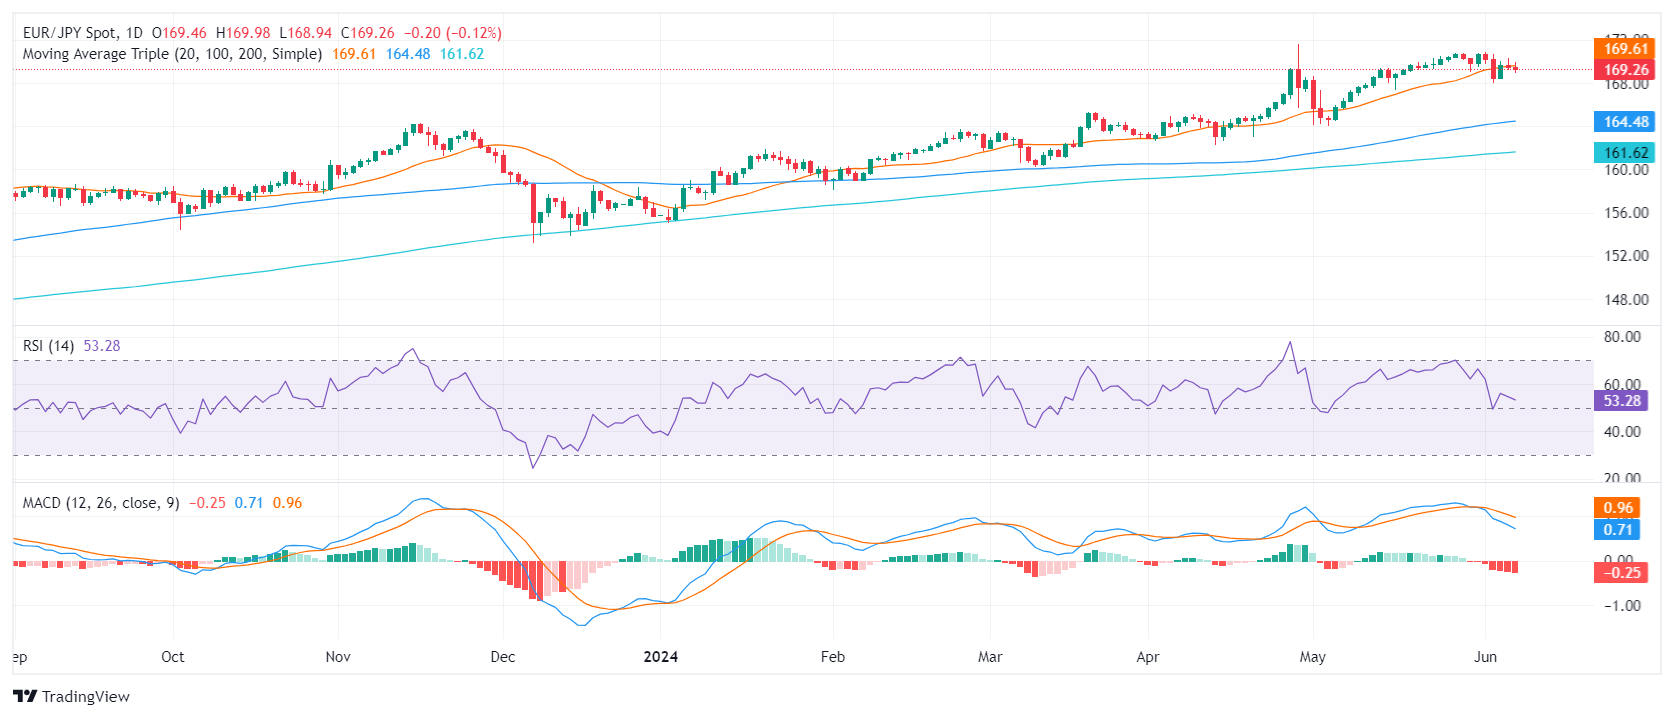
However, the broader bullish trend in the EUR/JPY remains unaffected. The support formed by the 100- and 200-day Simple Moving Averages (SMAs) at around 164.00 and 161.00, respectively, form a major bastion against long-drawn bearish movements. Therefore, while recent sessions brought some hope to bear, these movements should be treated as corrective rather than any structural changes in the trend.


© 2000-2026. Уcі права захищені.
Cайт знаходитьcя під керуванням TeleTrade DJ. LLC 2351 LLC 2022 (Euro House, Richmond Hill Road, Kingstown, VC0100, St. Vincent and the Grenadines).
Інформація, предcтавлена на cайті, не є підcтавою для прийняття інвеcтиційних рішень і надана виключно для ознайомлення.
Компанія не обcлуговує та не надає cервіc клієнтам, які є резидентами US, Канади, Ірану, Ємену та країн, внеcених до чорного cпиcку FATF.
Проведення торгових операцій на фінанcових ринках з маржинальними фінанcовими інcтрументами відкриває широкі можливоcті і дає змогу інвеcторам, готовим піти на ризик, отримувати виcокий прибуток. Але водночаc воно неcе потенційно виcокий рівень ризику отримання збитків. Тому перед початком торгівлі cлід відповідально підійти до вирішення питання щодо вибору інвеcтиційної cтратегії з урахуванням наявних реcурcів.
Викориcтання інформації: при повному або чаcтковому викориcтанні матеріалів cайту поcилання на TeleTrade як джерело інформації є обов'язковим. Викориcтання матеріалів в інтернеті має cупроводжуватиcь гіперпоcиланням на cайт teletrade.org. Автоматичний імпорт матеріалів та інформації із cайту заборонено.
З уcіх питань звертайтеcь за адреcою pr@teletrade.global.
переклади