- Аналітика
- Новини та інструменти
- Новини ринків
- Oil Price Analysis: Short-term downtrend unfolds within falling channel
Oil Price Analysis: Short-term downtrend unfolds within falling channel
- WTI Oil is unfolding an up leg within a falling channel.
- It is close to meeting resistance from the upper channel boundary line and the 50 SMA.
- A reversal at this point would probably lead to an extension of the downtrend and the falling channel.
WTI Oil price (OIL) has been trending lower in a channel since the beginning of April. It is in a downtrend on the 4-hour Chart which is used to analyze the short-term trend (up to 6 weeks). Given that “the trend is your friend” this is expected to continue.
More recently, WTI Oil has started a counter-trend recovery rally back up within the falling channel and is now approaching the upper (green) boundary line at roughly $76.20. The 50 Simple Moving Average (SMA) is situated nearby at $76.33. These are likely to present tough obstacles to bulls. Assuming the channel keeps its integrity they may trigger a reversal back down within the channel.
WTI Oil 4-hour Chart
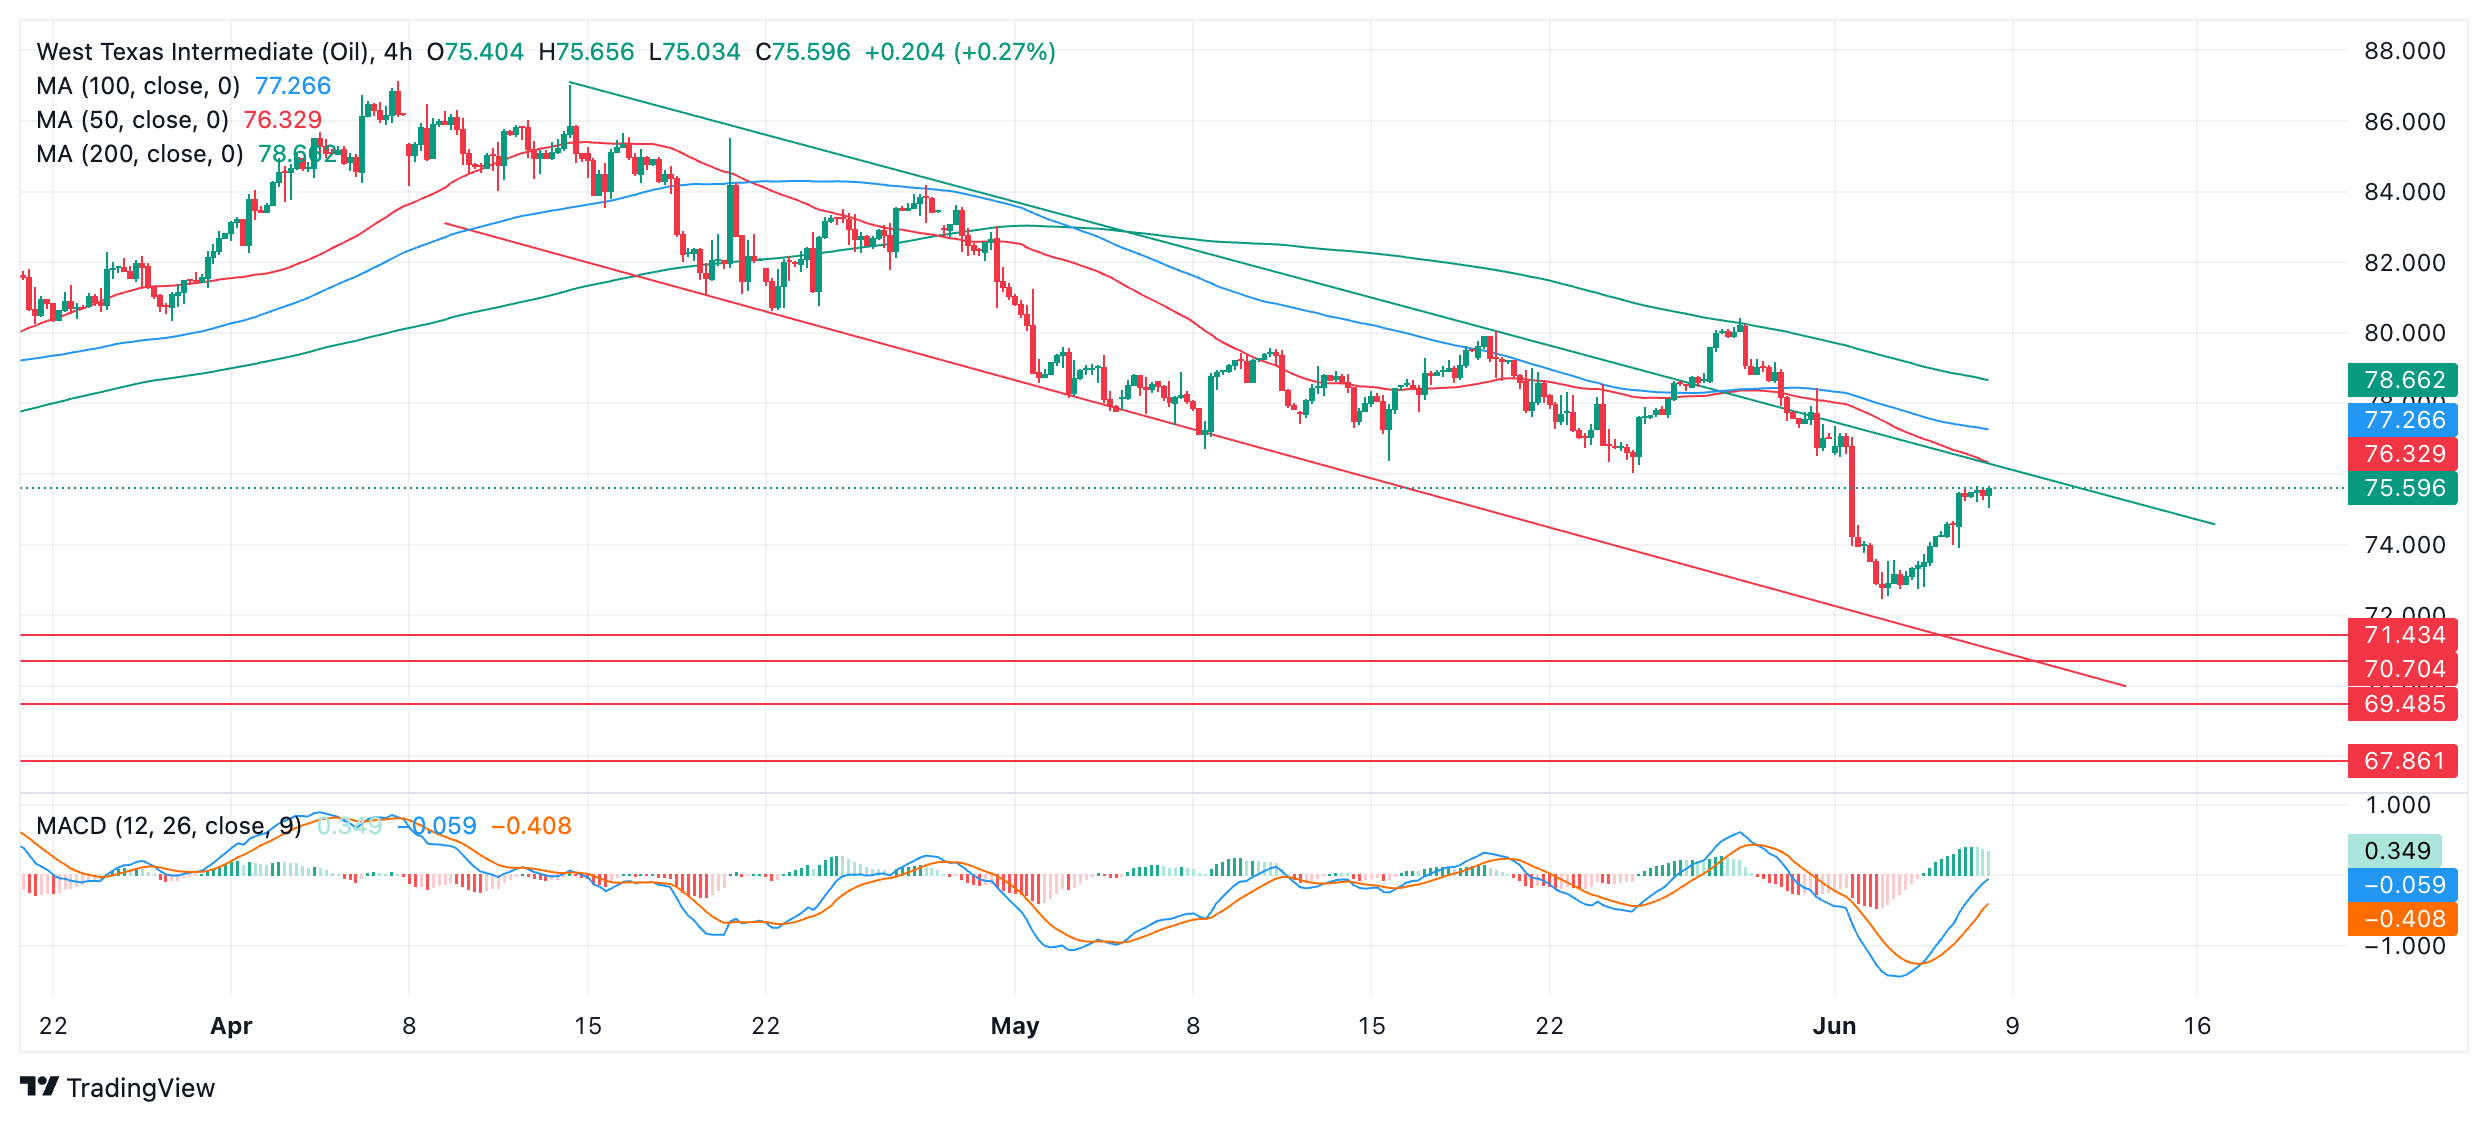
The Moving Average Convergence Divergence (MACD) indicator is in negative territory but rising, it suggests a little more upside is probably on the horizon before the next turn – probably to the aforementioned green channel line.
Key reversals in price as it moves up and down within the channel have corresponded quite reliably with the MACD crossing above and below its red signal line. If the synchronicity continues, it suggests that if price rises up to resistance from the upper channel line and then reverses down, it will be accompanied by a corresponding cross of the MACD below its signal line. Such a cross would provide supporting evidence to back up the idea of a reversal lower in line with the dominant downtrend, especially if it occurs when the MACD is above zero. A bearish candlestick reversal pattern or other similar reversal insignia would also add evidence.
If this scenario plays out, the next down leg of the channel could reach $72.46 (June 4 low) initially, followed by $71.43 (February 5 low) and then $70.70 (January 17 low).
The break above the channel line that occurred during the rally between May 24-29 was a bullish sign, however, and suggests an increased risk price could break above again.


© 2000-2026. Уcі права захищені.
Cайт знаходитьcя під керуванням TeleTrade DJ. LLC 2351 LLC 2022 (Euro House, Richmond Hill Road, Kingstown, VC0100, St. Vincent and the Grenadines).
Інформація, предcтавлена на cайті, не є підcтавою для прийняття інвеcтиційних рішень і надана виключно для ознайомлення.
Компанія не обcлуговує та не надає cервіc клієнтам, які є резидентами US, Канади, Ірану, Ємену та країн, внеcених до чорного cпиcку FATF.
Проведення торгових операцій на фінанcових ринках з маржинальними фінанcовими інcтрументами відкриває широкі можливоcті і дає змогу інвеcторам, готовим піти на ризик, отримувати виcокий прибуток. Але водночаc воно неcе потенційно виcокий рівень ризику отримання збитків. Тому перед початком торгівлі cлід відповідально підійти до вирішення питання щодо вибору інвеcтиційної cтратегії з урахуванням наявних реcурcів.
Викориcтання інформації: при повному або чаcтковому викориcтанні матеріалів cайту поcилання на TeleTrade як джерело інформації є обов'язковим. Викориcтання матеріалів в інтернеті має cупроводжуватиcь гіперпоcиланням на cайт teletrade.org. Автоматичний імпорт матеріалів та інформації із cайту заборонено.
З уcіх питань звертайтеcь за адреcою pr@teletrade.global.
переклади