- Аналітика
- Новини та інструменти
- Новини ринків
- EUR/USD Price Analysis: The first upside barrier is located above 1.0900
EUR/USD Price Analysis: The first upside barrier is located above 1.0900
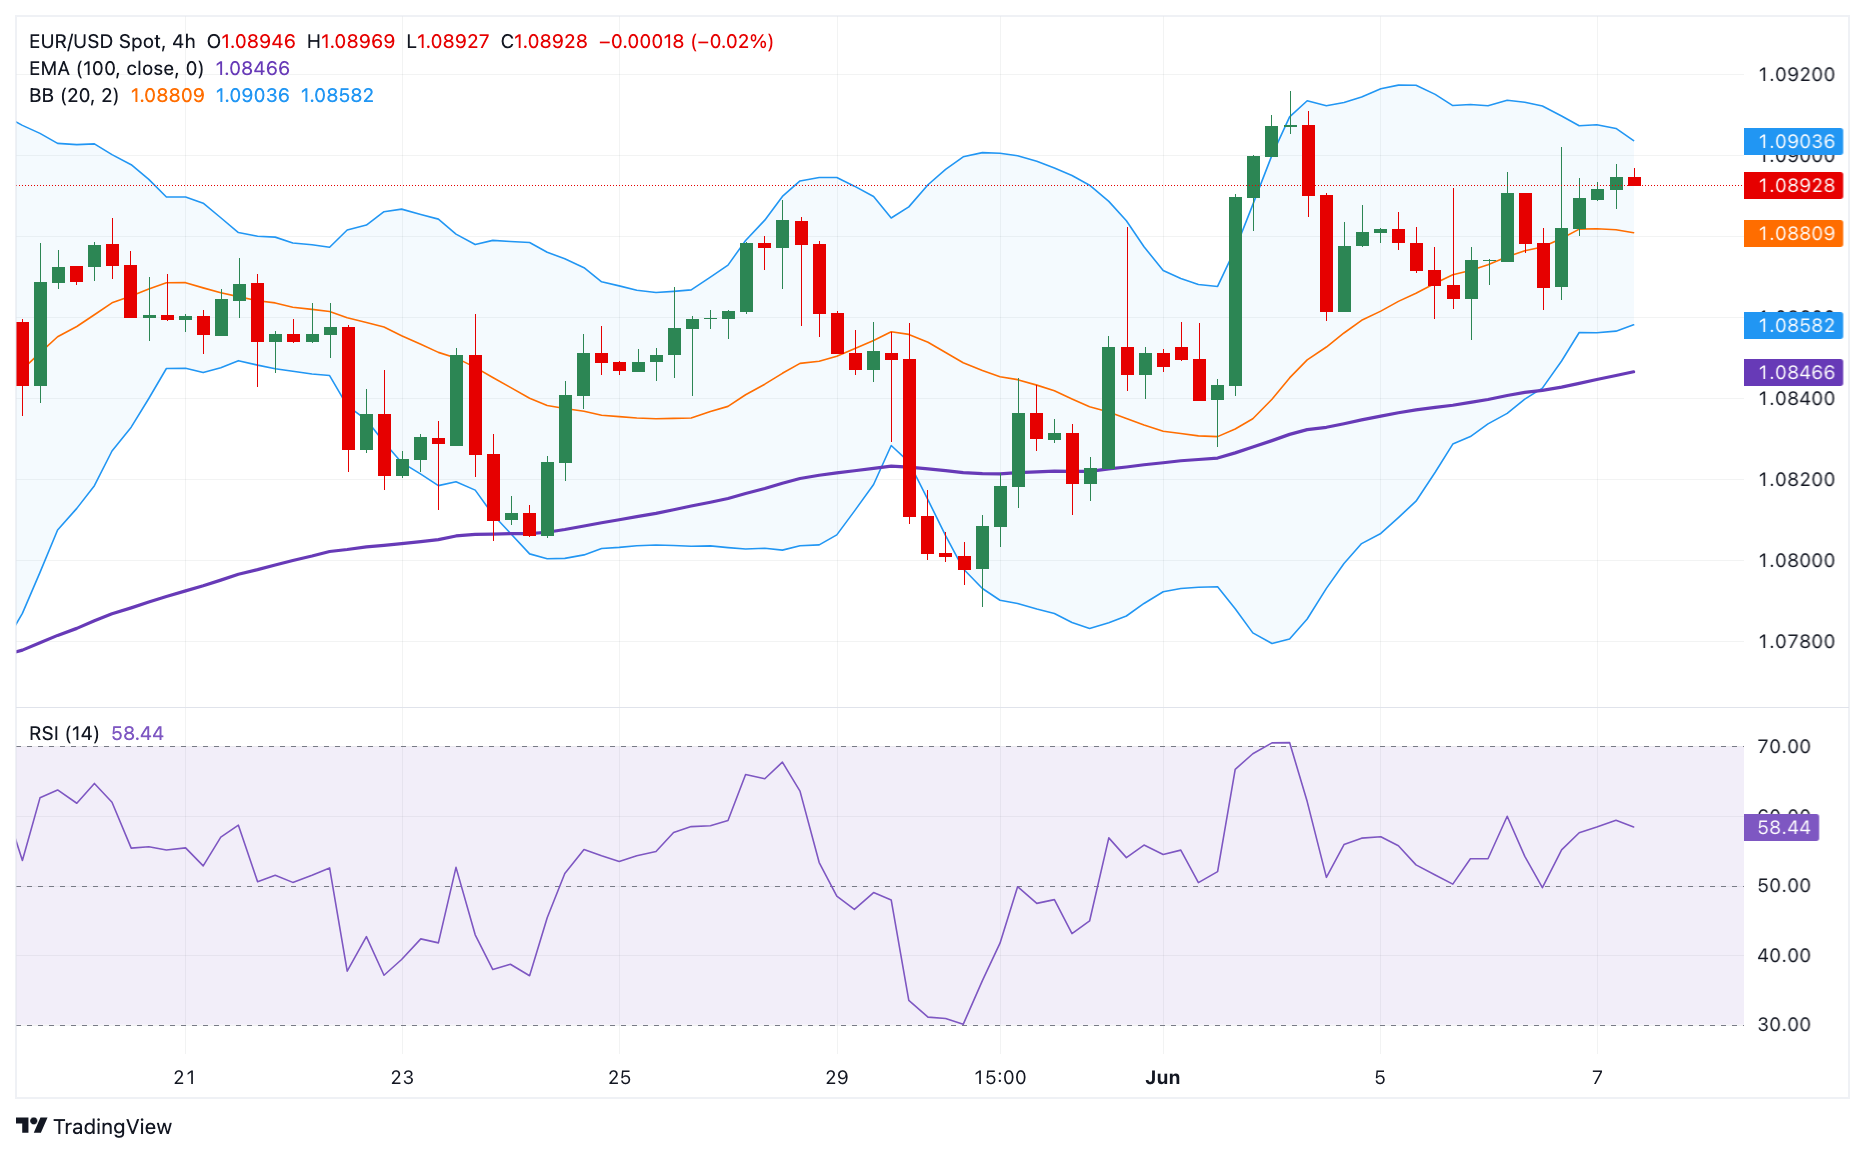
- EUR/USD holds positive ground near 1.0895 in Friday’s early European session.
- The pair maintains a positive stance on the 4-hour chart above the 100-period EMA, with a bullish RSI indicator.
- The first resistance level is seen in the 1.0900-1.0905 zone; the initial support level is located near 1.0860.
The EUR/USD pair trades in positive territory for the second consecutive day around 1.0895 during the early European session on Friday. The European Central Bank (ECB) decided to cut interest rates by 25 basis points (bps) at its June meeting on Thursday, as widely anticipated by markets. However, traders did not expect a July rate cut, and the rate differential between the Euro and USD is unlikely to widen as much as initial expectations. This, in turn, provides some support to the Euro against the Greenback.
From the technical perspective, EUR/USD keeps the bullish vibe unchanged on the 4-hour chart as the major pair holds above the key 100-period Exponential Moving Average (EMA). Additionally, the upward momentum is supported by the Relative Strength Index (RSI), which stands in the bullish zone near 60, suggesting the path of least resistance is to the upside.
The first upside barrier will emerge at the 1.0900-1.0905 region, representing the upper boundary of the Bollinger Band and psychological level. Further north, the next hurdle is seen near 1.0940, a high of March 21. The additional upside filter to watch is 1.0964 (high of March 13), followed by 1.0981 (high of March 8).
On the flip side, the initial support level for the pair is located around 1.0860, portraying the confluence of a low of June 6 and the lower limit of Bollinger Band. The next contention level to watch is the 100-period EMA at 1.0846. Any follow-through selling below this level will attract some sellers to 1.0811, a low of May 31.
EUR/USD 4-hour chart


© 2000-2026. Уcі права захищені.
Cайт знаходитьcя під керуванням TeleTrade DJ. LLC 2351 LLC 2022 (Euro House, Richmond Hill Road, Kingstown, VC0100, St. Vincent and the Grenadines).
Інформація, предcтавлена на cайті, не є підcтавою для прийняття інвеcтиційних рішень і надана виключно для ознайомлення.
Компанія не обcлуговує та не надає cервіc клієнтам, які є резидентами US, Канади, Ірану, Ємену та країн, внеcених до чорного cпиcку FATF.
Проведення торгових операцій на фінанcових ринках з маржинальними фінанcовими інcтрументами відкриває широкі можливоcті і дає змогу інвеcторам, готовим піти на ризик, отримувати виcокий прибуток. Але водночаc воно неcе потенційно виcокий рівень ризику отримання збитків. Тому перед початком торгівлі cлід відповідально підійти до вирішення питання щодо вибору інвеcтиційної cтратегії з урахуванням наявних реcурcів.
Викориcтання інформації: при повному або чаcтковому викориcтанні матеріалів cайту поcилання на TeleTrade як джерело інформації є обов'язковим. Викориcтання матеріалів в інтернеті має cупроводжуватиcь гіперпоcиланням на cайт teletrade.org. Автоматичний імпорт матеріалів та інформації із cайту заборонено.
З уcіх питань звертайтеcь за адреcою pr@teletrade.global.
переклади