- Аналітика
- Новини та інструменти
- Новини ринків
- EUR/JPY Price Analysis: Momentum shifts, bulls recover 20-day SMA
EUR/JPY Price Analysis: Momentum shifts, bulls recover 20-day SMA
- The daily RSI has shifted its course upwards, backed by the flat red bars on the MACD.
- Buyers stepped in to recover 20-Day SMA, shifting the short-term outlook from bearish to neutral.
- The underlying bullish trend is still safeguarded by the 100 and 200-day SMAs.
In Wednesday's session, the EUR/JPY pair witnessed a shift in momentum as buyers stepped in to recover the 20-day Simple Moving Average (SMA) at 169.40, supported by a recovery in the Yen against its peers. This bullish shift counters the bearish momentum from Tuesday's session as the pair emerges from local lows of 168.50.
The Relative Strength Index (RSI) on the daily chart has shown an upward shift from 48 to 54. This suggests an increase in buying momentum, potentially paving the way for a more substantial upside movement. The flat red bars on the daily Moving Average Convergence Divergence (MACD) further support this improving outlook.
EUR/JPY daily chart
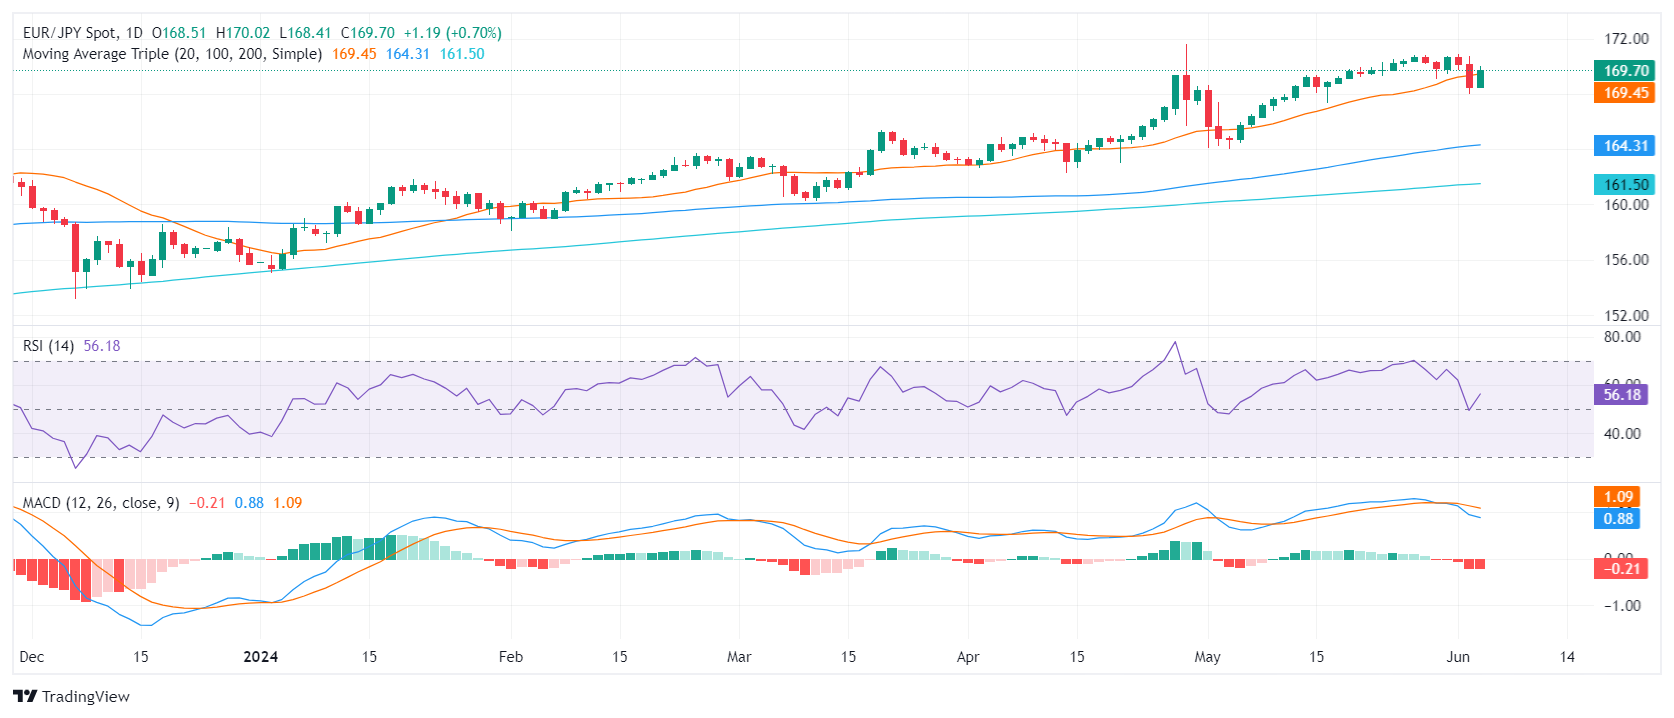
Despite the bearish undertones in the short term, the overall bullish trend remains unaffected. The support offered by the 100 and 200-day Simple Moving Averages (SMAs) at 164.00 and 161.00, respectively, still serve as a barrier to any prolonged downside movements. While sellers have made significant ground in previous sessions, these movements could be corrective rather than trend-reversing.
Although the cross managed to recover ground, the picture could quickly shift back to bearish if the cross fails to hold the recently-gained 169.40 resistance level. For the bulls to maintain momentum, a break back above this level is necessary, which would allow the pair to target the next key level of 170.00.


© 2000-2026. Уcі права захищені.
Cайт знаходитьcя під керуванням TeleTrade DJ. LLC 2351 LLC 2022 (Euro House, Richmond Hill Road, Kingstown, VC0100, St. Vincent and the Grenadines).
Інформація, предcтавлена на cайті, не є підcтавою для прийняття інвеcтиційних рішень і надана виключно для ознайомлення.
Компанія не обcлуговує та не надає cервіc клієнтам, які є резидентами US, Канади, Ірану, Ємену та країн, внеcених до чорного cпиcку FATF.
Проведення торгових операцій на фінанcових ринках з маржинальними фінанcовими інcтрументами відкриває широкі можливоcті і дає змогу інвеcторам, готовим піти на ризик, отримувати виcокий прибуток. Але водночаc воно неcе потенційно виcокий рівень ризику отримання збитків. Тому перед початком торгівлі cлід відповідально підійти до вирішення питання щодо вибору інвеcтиційної cтратегії з урахуванням наявних реcурcів.
Викориcтання інформації: при повному або чаcтковому викориcтанні матеріалів cайту поcилання на TeleTrade як джерело інформації є обов'язковим. Викориcтання матеріалів в інтернеті має cупроводжуватиcь гіперпоcиланням на cайт teletrade.org. Автоматичний імпорт матеріалів та інформації із cайту заборонено.
З уcіх питань звертайтеcь за адреcою pr@teletrade.global.
переклади