- Аналітика
- Новини та інструменти
- Новини ринків
- USD/JPY Price Analysis: Erases previous-day losses and climbs above 156.00
USD/JPY Price Analysis: Erases previous-day losses and climbs above 156.00
- USD/JPY climbs and gains 0.79%, supported by strong US economic data.
- Technical outlook shows a bullish harami pattern, indicating potential for further gains.
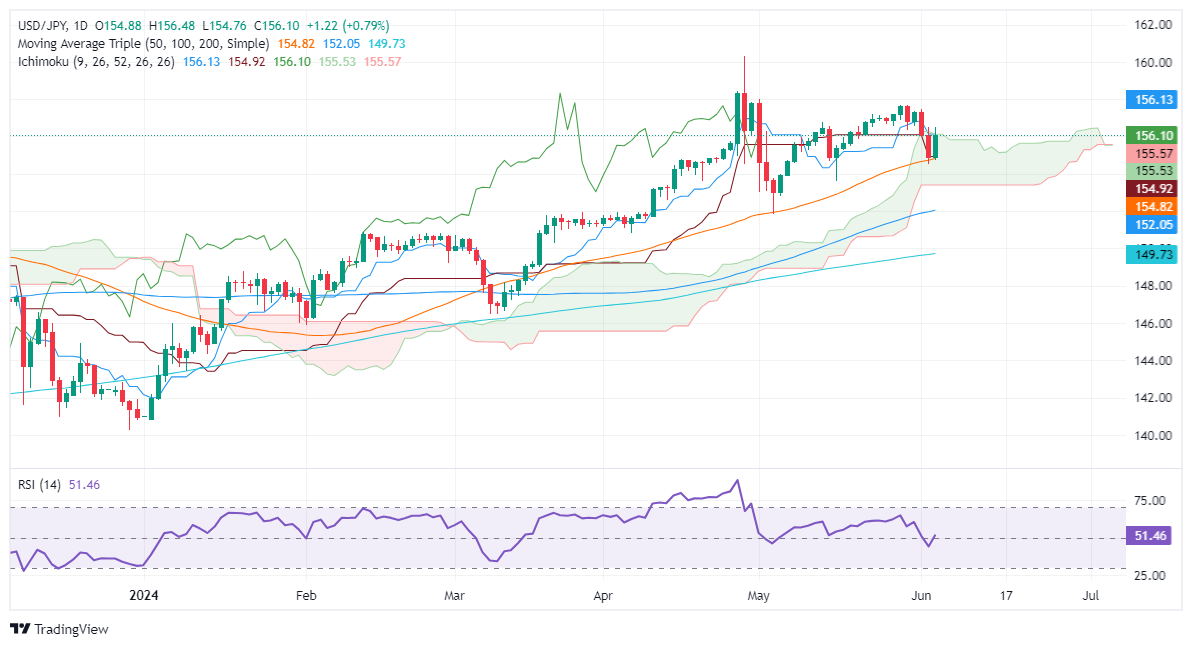
- Key resistance levels: 156.50, May 30 high at 157.68, and YTD high at 160.32; support at 156.00, 155.00, and confluence of Tenkan-Sen and 50-DMA at 154.81/92.
The USD/JPY recovered some ground and advanced towards the top of the Ichimoku Cloud (Kumo) on Wednesday, gaining some 0.79% and trading at 156.11 at the time of writing. Data from the United States kept the Greenback bid while falling Japanese Government Bond (JGB) yields undermined the Yen.
USD/JPY Price Analysis: Technical outlook
From a technical perspective, the USD/JPY remains upward biased despite retreating toward the 50-day moving average (DMA) at 154.82 on Tuesday. However, buyers lifted the exchange rate towards current levels, forming a ‘bullish harami’ candlestick chart pattern that could open the door for further gains.
Short-term momentum is on the buyers’ side, as depicted by the Relative Strength Index (RSI) standing in bullish territory.
The USD/JPY first resistance would be the 156.50 mark. A breach of the latte will expose the May 30 high of 157.68 before rallying toward the April 26 high of 158.44. Up next would be the year-to-date (YTD) high of 160.32.
On the flip side, the USD/JPY's first support would be 156.00. Once surpassed, the next stop would be 155.00, before testing the confluence of the Tenkan-Sen and the 50-DMA at around 154.81/92.
USD/JPY Price Action – Daily Chart


© 2000-2026. Уcі права захищені.
Cайт знаходитьcя під керуванням TeleTrade DJ. LLC 2351 LLC 2022 (Euro House, Richmond Hill Road, Kingstown, VC0100, St. Vincent and the Grenadines).
Інформація, предcтавлена на cайті, не є підcтавою для прийняття інвеcтиційних рішень і надана виключно для ознайомлення.
Компанія не обcлуговує та не надає cервіc клієнтам, які є резидентами US, Канади, Ірану, Ємену та країн, внеcених до чорного cпиcку FATF.
Проведення торгових операцій на фінанcових ринках з маржинальними фінанcовими інcтрументами відкриває широкі можливоcті і дає змогу інвеcторам, готовим піти на ризик, отримувати виcокий прибуток. Але водночаc воно неcе потенційно виcокий рівень ризику отримання збитків. Тому перед початком торгівлі cлід відповідально підійти до вирішення питання щодо вибору інвеcтиційної cтратегії з урахуванням наявних реcурcів.
Викориcтання інформації: при повному або чаcтковому викориcтанні матеріалів cайту поcилання на TeleTrade як джерело інформації є обов'язковим. Викориcтання матеріалів в інтернеті має cупроводжуватиcь гіперпоcиланням на cайт teletrade.org. Автоматичний імпорт матеріалів та інформації із cайту заборонено.
З уcіх питань звертайтеcь за адреcою pr@teletrade.global.
переклади