- Аналітика
- Новини та інструменти
- Новини ринків
- GBP/USD Price Analysis: Remains close to over two-month peak, bullish potential intact
GBP/USD Price Analysis: Remains close to over two-month peak, bullish potential intact
- GBP/USD attracts fresh buying on Wednesday amid the underlying USD bearish tone.
- Divergent Fed-BoE policy expectations turn out to be another factor lending support.
- The technical setup favors bullish traders and supports prospects for additional gains.
The GBP/USD pair trades with a mild positive bias around the 1.2775-1.2780 area during the Asian session on Wednesday and remains well within the striking distance of its highest level since March 14 touched the previous day.
The US Dollar (USD) struggles to capitalize on the overnight bounce from over a two-month low in the wake of rising bets for an imminent interest rate cut by the Federal Reserve (Fed) later this year. Furthermore, expectations that the Bank of England (BoE) might keep interest rates at their current level for a little bit longer continue to underpin the British Pound (GBP) and act as a tailwind for the GBP/USD pair.
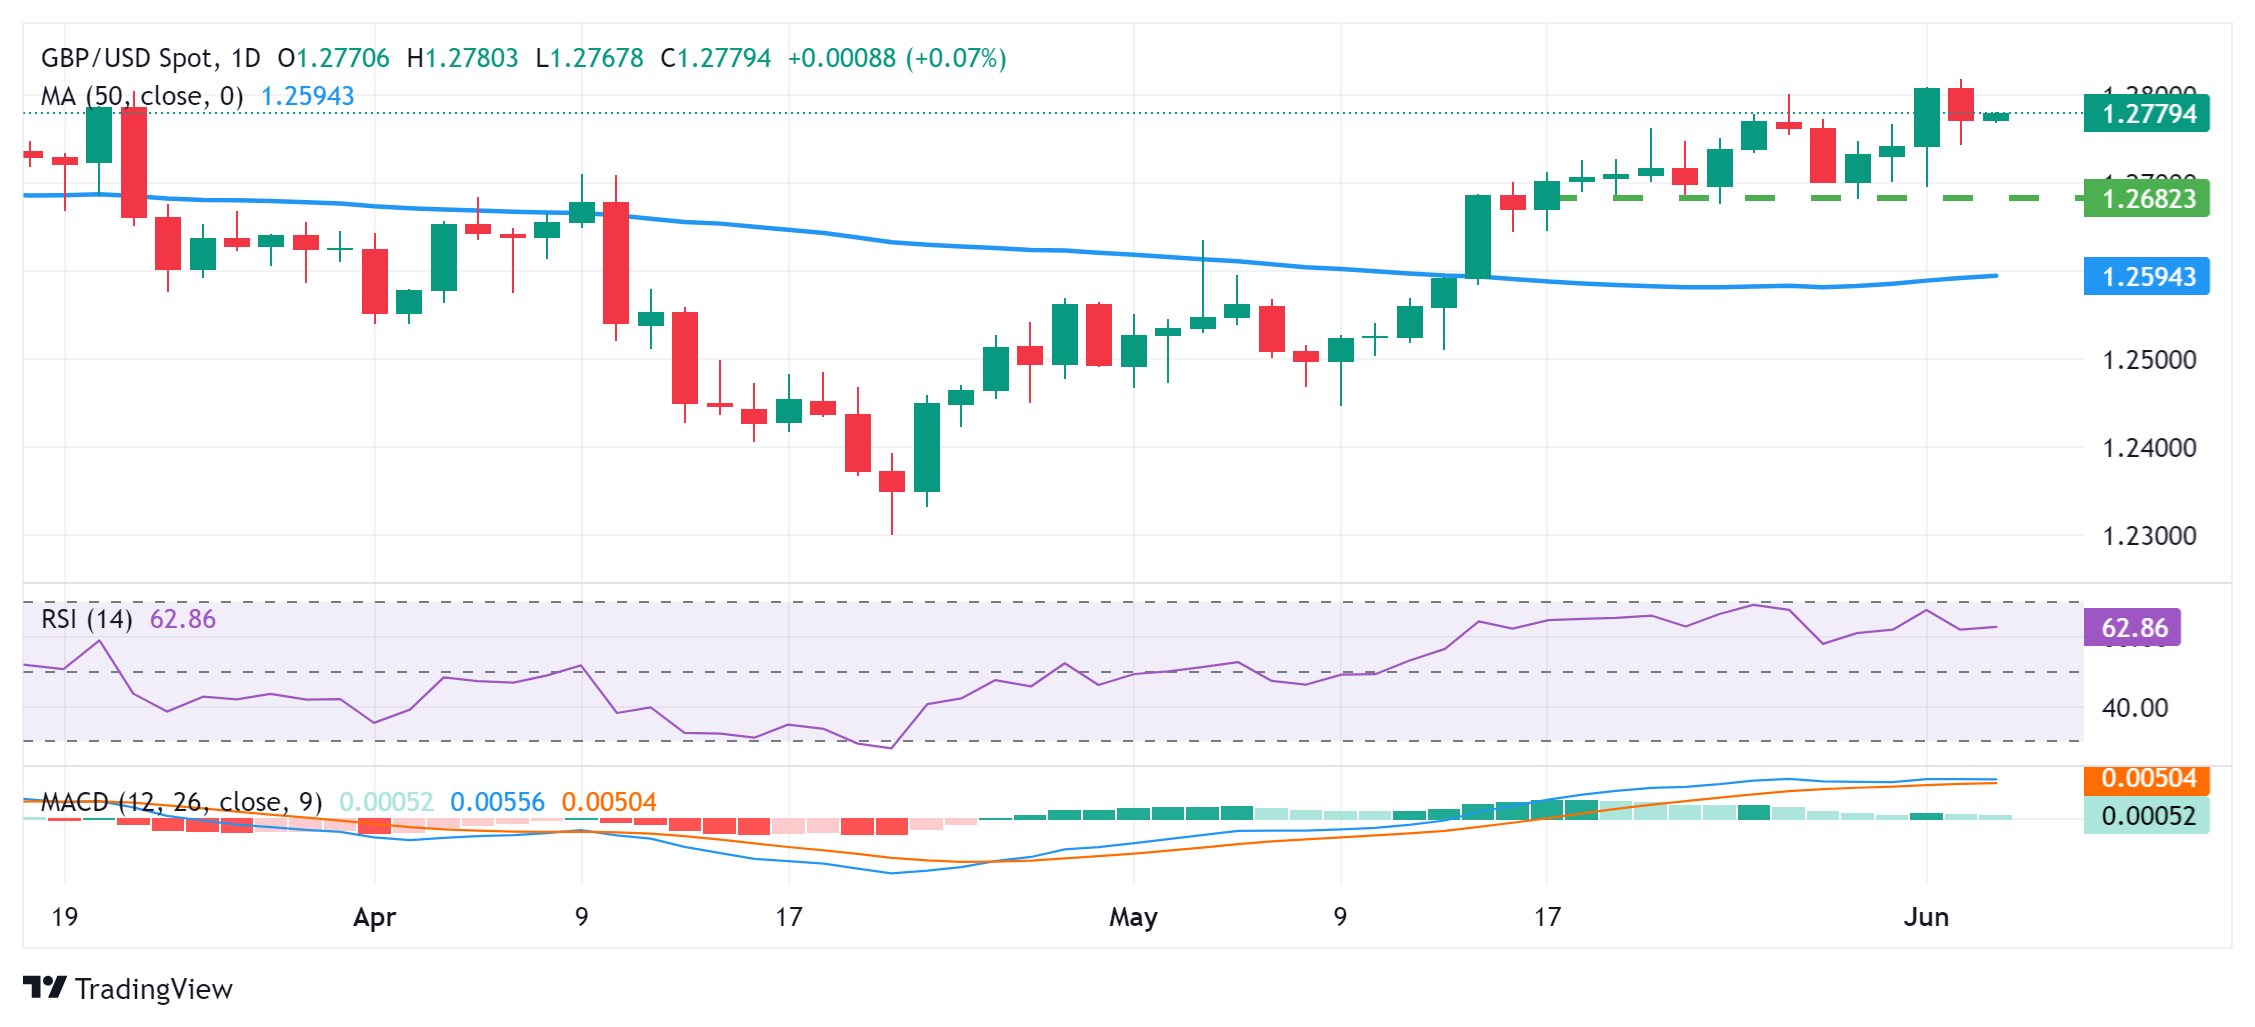
From a technical perspective, oscillators on the daily chart are holding in the positive territory and are still away from being in the overbought zone. This, in turn, supports prospects for further gains. Some follow-through buying beyond the 1.2800 mark will reaffirm the positive bias and lift the GBP/USD pair to the 1.2855-1.2860 area en route to the 1.2900 neighborhood or the YTD peak touched in March.
On the flip side, the overnight swing low, around the 1.2745-1.2740 region, now seems to protect the immediate downside ahead of the 1.2725-1.2720 area. The latter is followed by the 1.2700 mark, which if broken should pave the way for a slide towards the next relevant support near mid-1.2600s. Spot prices might eventually drop to test sub-1.2600 levels, or the 50-day Simple Moving Average (SMA) support.
GBP/USD daily chart


© 2000-2026. Уcі права захищені.
Cайт знаходитьcя під керуванням TeleTrade DJ. LLC 2351 LLC 2022 (Euro House, Richmond Hill Road, Kingstown, VC0100, St. Vincent and the Grenadines).
Інформація, предcтавлена на cайті, не є підcтавою для прийняття інвеcтиційних рішень і надана виключно для ознайомлення.
Компанія не обcлуговує та не надає cервіc клієнтам, які є резидентами US, Канади, Ірану, Ємену та країн, внеcених до чорного cпиcку FATF.
Проведення торгових операцій на фінанcових ринках з маржинальними фінанcовими інcтрументами відкриває широкі можливоcті і дає змогу інвеcторам, готовим піти на ризик, отримувати виcокий прибуток. Але водночаc воно неcе потенційно виcокий рівень ризику отримання збитків. Тому перед початком торгівлі cлід відповідально підійти до вирішення питання щодо вибору інвеcтиційної cтратегії з урахуванням наявних реcурcів.
Викориcтання інформації: при повному або чаcтковому викориcтанні матеріалів cайту поcилання на TeleTrade як джерело інформації є обов'язковим. Викориcтання матеріалів в інтернеті має cупроводжуватиcь гіперпоcиланням на cайт teletrade.org. Автоматичний імпорт матеріалів та інформації із cайту заборонено.
З уcіх питань звертайтеcь за адреcою pr@teletrade.global.
переклади