- Аналітика
- Новини та інструменти
- Новини ринків
- USD/JPY Price Analysis: Struggles at 157.00 as bearish engulfing chart pattern looms
USD/JPY Price Analysis: Struggles at 157.00 as bearish engulfing chart pattern looms
- USD/JPY retreats as it forms a bearish engulfing candle chart pattern.
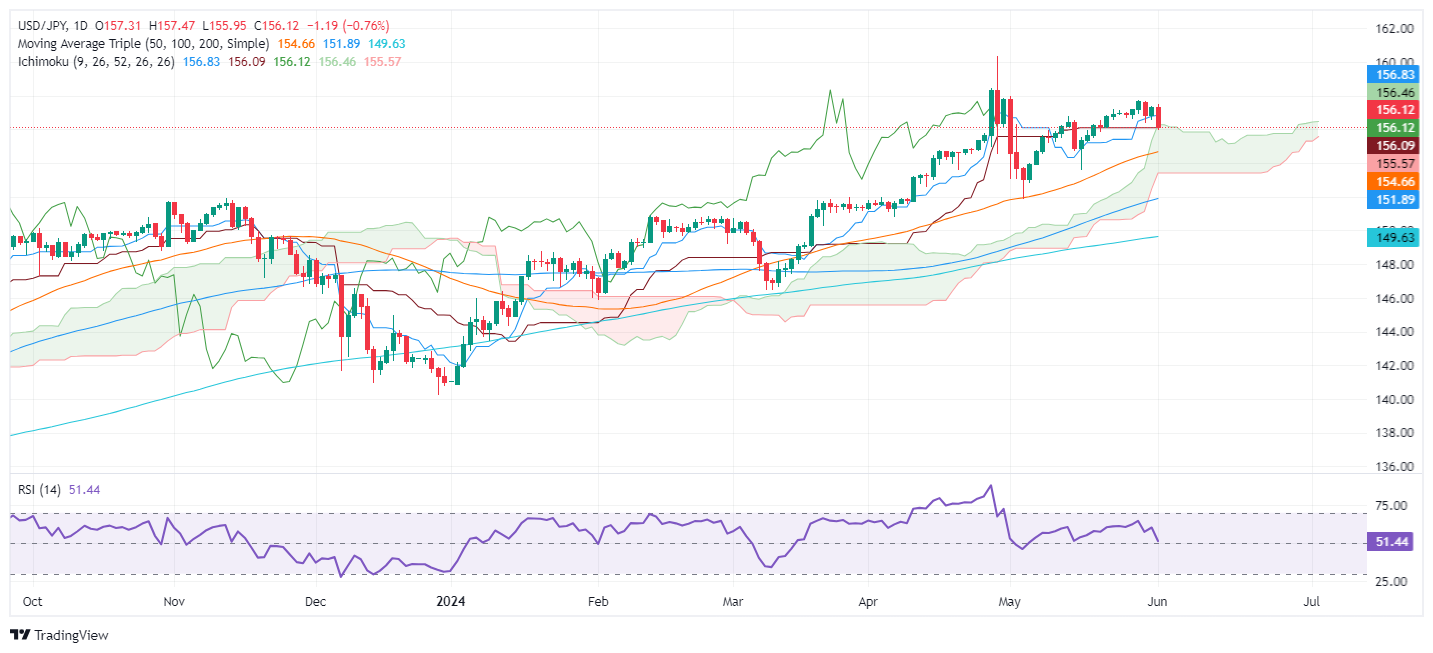
- Technical outlook: USD/JPY drops below Ichimoku Cloud top at 155.95, hinting at potential further declines.
- Key support levels: Tenkan-Sen at 154.92, 50-DMA at 154.74, and trendline at 154.20; resistance at Kumo top 156.15/20 and May 29 high of 157.71.
The USD/JPY retreated more than 0.70% on Monday following softer-than-expected business activity data in the United States (US). That, along with last Friday’s inflation report, the Fed’s Core PCE, reignited speculation that the US central bank could slash rates toward the end of the year. The pair trades at 156.14.
USD/JPY Price Analysis: Technical outlook
From a daily chart perspective, the USD/JPY failed to pierce the 157.50 resistance level and dived below the 157.00 figure, exacerbating a drop below the top of the Ichimoku Cloud (Kumo) at around 155.95, opening the door for further losses.
Even though momentum favors buyers, as depicted by the Relative Strength Index (RSI), it has turned flat close to the 50 midlines, about to enter bearish territory.
In the short term, the USD/JPY is neutral to downward biased. The first support would be the Tenkan-Sen at 154.92, followed by the 50-day moving average (DMA) at 154.74. Once cleared, the next stop would be an upslope support trendline at 154.20 before testing the bottom of the Kumo at 153.30/40.
Conversely, if USD/JPY climbs above the top of the Kumo at around 156.15/20, that would sponsor an uptick toward the May 29 high at 157.71.
USD/JPY Price Action – Daily Chart


© 2000-2026. Уcі права захищені.
Cайт знаходитьcя під керуванням TeleTrade DJ. LLC 2351 LLC 2022 (Euro House, Richmond Hill Road, Kingstown, VC0100, St. Vincent and the Grenadines).
Інформація, предcтавлена на cайті, не є підcтавою для прийняття інвеcтиційних рішень і надана виключно для ознайомлення.
Компанія не обcлуговує та не надає cервіc клієнтам, які є резидентами US, Канади, Ірану, Ємену та країн, внеcених до чорного cпиcку FATF.
Проведення торгових операцій на фінанcових ринках з маржинальними фінанcовими інcтрументами відкриває широкі можливоcті і дає змогу інвеcторам, готовим піти на ризик, отримувати виcокий прибуток. Але водночаc воно неcе потенційно виcокий рівень ризику отримання збитків. Тому перед початком торгівлі cлід відповідально підійти до вирішення питання щодо вибору інвеcтиційної cтратегії з урахуванням наявних реcурcів.
Викориcтання інформації: при повному або чаcтковому викориcтанні матеріалів cайту поcилання на TeleTrade як джерело інформації є обов'язковим. Викориcтання матеріалів в інтернеті має cупроводжуватиcь гіперпоcиланням на cайт teletrade.org. Автоматичний імпорт матеріалів та інформації із cайту заборонено.
З уcіх питань звертайтеcь за адреcою pr@teletrade.global.
переклади