- Аналітика
- Новини та інструменти
- Новини ринків
- EUR/JPY Price Analysis: Pair struggles to gain ground as momentum wanes
EUR/JPY Price Analysis: Pair struggles to gain ground as momentum wanes
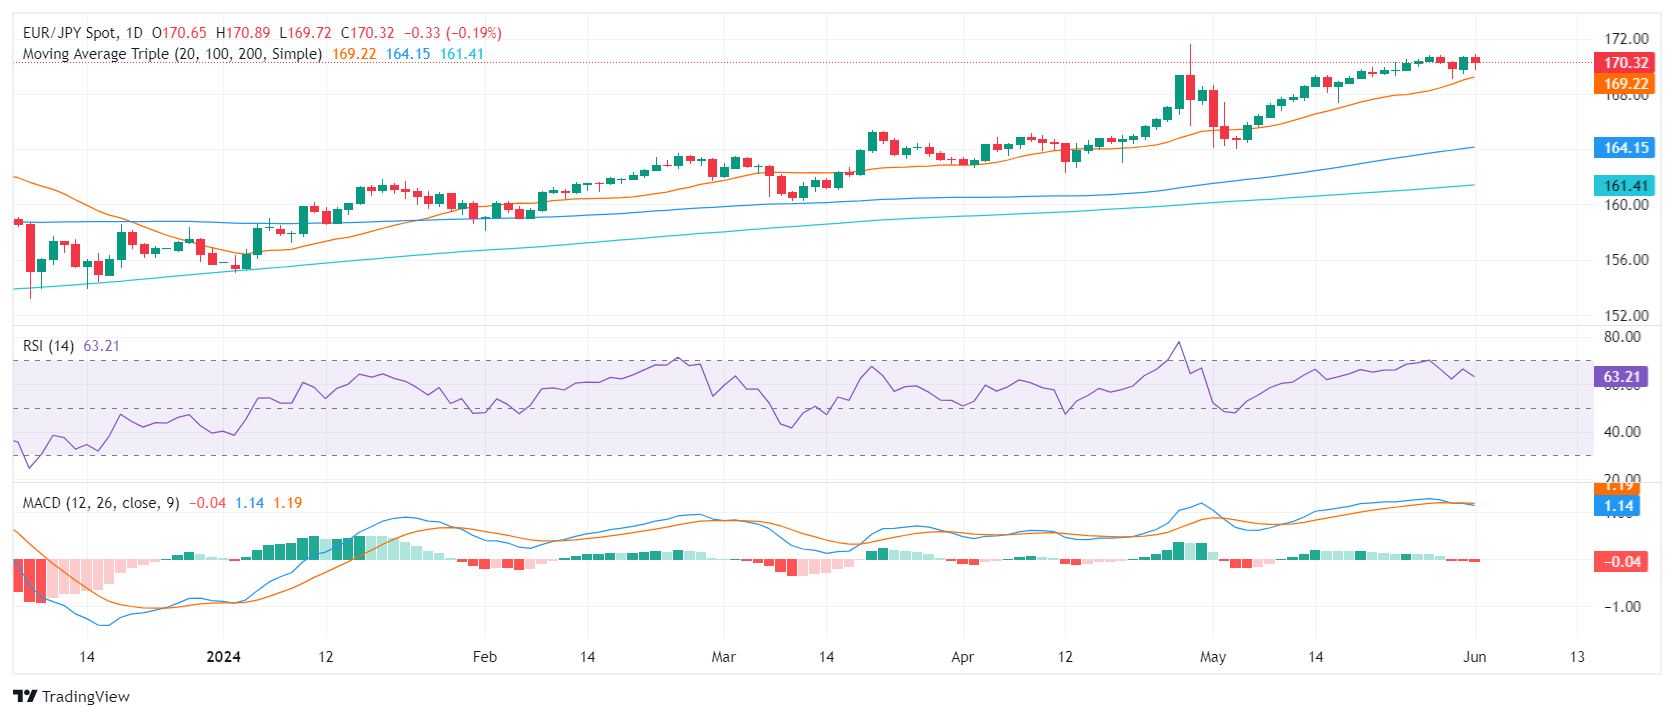
- The daily RSI has shifted downwards and with the MACD showing increasing red bars pointing to a slowdown in upward momentum.
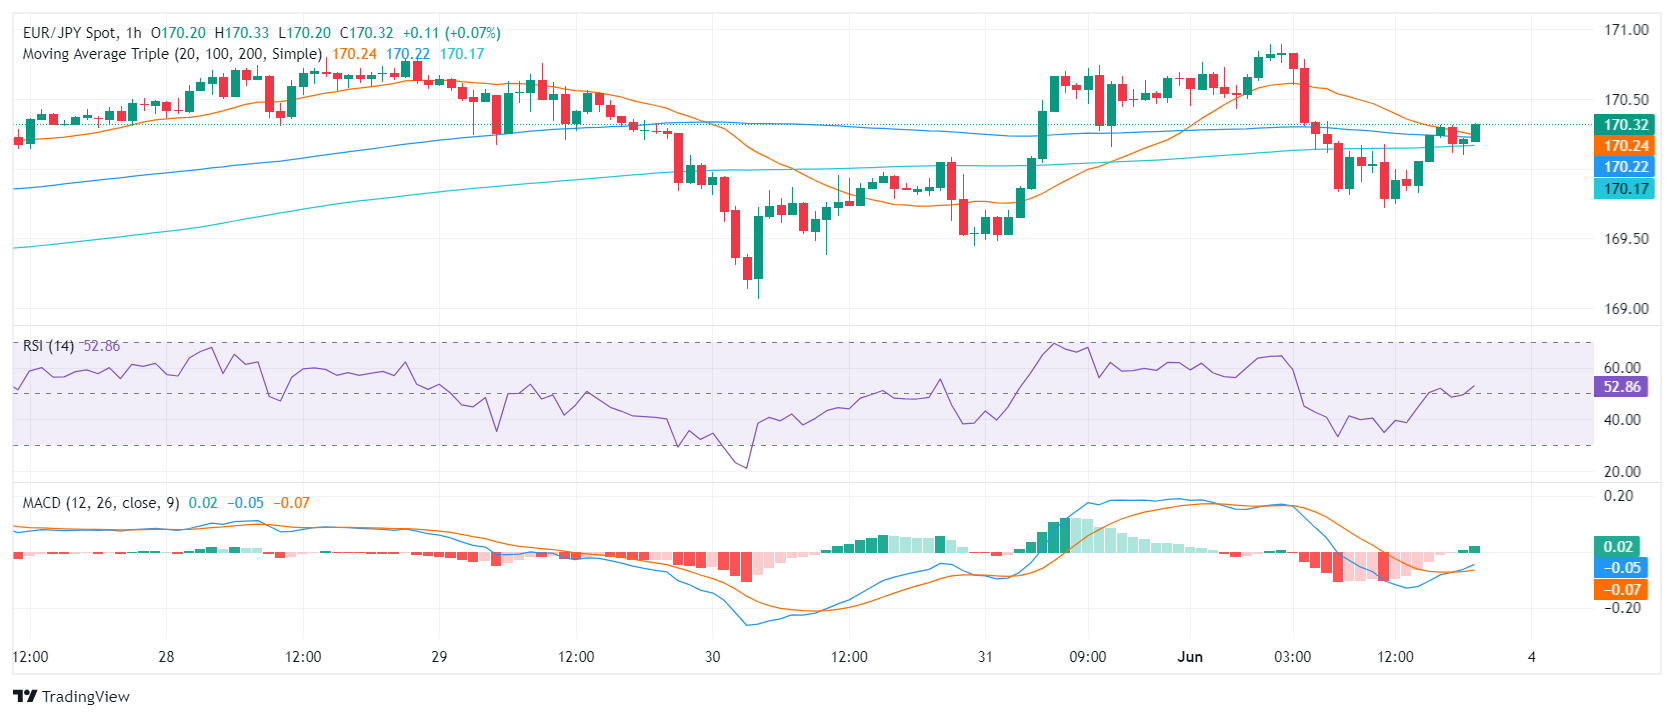
- On the hourly chart, indicators suggest moderate bullish momentum, supported by an increasing RSI and green bars in the MACD.
- The 20-day SMA at 169.22 serves as a critical support level for the pair to consolidate.
In Monday's session, a weak Yen against its rivals caused the EUR/JPY pair to slip to 170.30. Despite this slip, the pair's position remains solid above the key support level of the 20-day SMA at 169.22. However, as the pair currently hovers in overbought territory, the upside appears limited.
The daily Relative Strength Index (RSI) showed a reduction to 61, suggesting a potential slowdown in the pair's upward momentum. The daily MACD, with increasing red bars, agrees with this outlook..
EUR/JPY daily chart
On the hourly chart, the RSI suggests a moderate bullish momentum, standing at 51, marking a positive shift in the session. The hourly MACD, showing rising green bars, supports this short-term bullish sentiment. Nevertheless, because the pair is hovering in the overbought zone, the upward move may be short-lived.
EUR/JPY hourly chart
Meanwhile, the pair continues to trade above the significant support level of the 20-day Simple Moving Average (SMA). Should the position fall below this support level, sellers may meet further resistance at the 100 and 200-day SMAs, providing a safety barrier at around 164.00 and 161.00. As long as these support levels are defended, the overall bullish outlook remains intact, despite the possibility of consolidation. On the upside, the buyers must recapture the 167.00 area to continue moving upwards.


© 2000-2026. Уcі права захищені.
Cайт знаходитьcя під керуванням TeleTrade DJ. LLC 2351 LLC 2022 (Euro House, Richmond Hill Road, Kingstown, VC0100, St. Vincent and the Grenadines).
Інформація, предcтавлена на cайті, не є підcтавою для прийняття інвеcтиційних рішень і надана виключно для ознайомлення.
Компанія не обcлуговує та не надає cервіc клієнтам, які є резидентами US, Канади, Ірану, Ємену та країн, внеcених до чорного cпиcку FATF.
Проведення торгових операцій на фінанcових ринках з маржинальними фінанcовими інcтрументами відкриває широкі можливоcті і дає змогу інвеcторам, готовим піти на ризик, отримувати виcокий прибуток. Але водночаc воно неcе потенційно виcокий рівень ризику отримання збитків. Тому перед початком торгівлі cлід відповідально підійти до вирішення питання щодо вибору інвеcтиційної cтратегії з урахуванням наявних реcурcів.
Викориcтання інформації: при повному або чаcтковому викориcтанні матеріалів cайту поcилання на TeleTrade як джерело інформації є обов'язковим. Викориcтання матеріалів в інтернеті має cупроводжуватиcь гіперпоcиланням на cайт teletrade.org. Автоматичний імпорт матеріалів та інформації із cайту заборонено.
З уcіх питань звертайтеcь за адреcою pr@teletrade.global.
переклади