- Аналітика
- Новини та інструменти
- Новини ринків
- NZD/JPY Price Analysis: Sellers test strength as consolidation persists
NZD/JPY Price Analysis: Sellers test strength as consolidation persists
- Negative momentum nudges the NZD/JPY pair into a slight retreat, with consolidation continuing to dominate the trend.
- The sellers face a considerable barrier at the 96.30 area.
- The buying momentum continues to be limited.
During Monday's session, the NZD/JPY pair experienced a slight retreat as the sellers tried pushing past a strong resistance at the 96.30 area. However, the charm offensive from the buyers wasn't entirely diminished, holding the pair in a protracted consolidation phase over the course of the day.
Though still well within positive territory, the Relative Strength Index (RSI) has dropped to 67, from 71. This drop, mild in nature, indicates a reduction in the momentum that characterized the previous session's overbought situation However, on Monday the index managed to jump back near the 70 threshold suggesting that there is still more toom to correct. Concurrently, the Moving Average Convergence Divergence (MACD) continues to register decreasing green bars, suggesting a decline in buying momentum. The combination of these factors implies the potential for a continued period of consolidation, rather than a reversal of the uptrend seen recently.
NZD/JPY daily chart
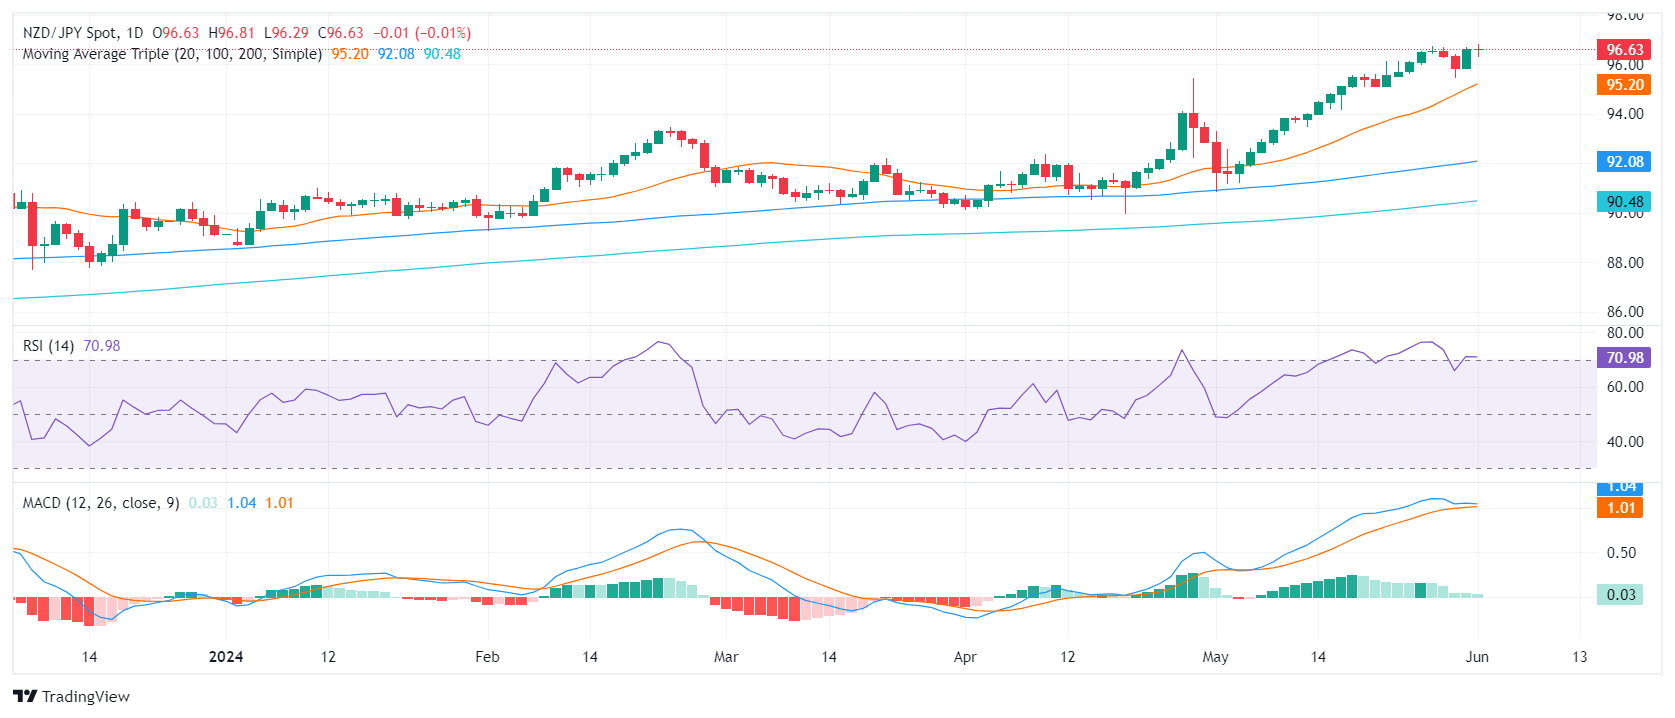
This retreat is by no means a synonym for reversal. The outlook still remains positive, and the NZD/JPY pair continues to rest well above a healthy support level at 95.50. For the balance to tip in favor of the sellers, they would need to crack this support and break below the 20-day Simple Moving Average (SMA) at 95.20, a level that has provided reliable support for buyers since the beginning of May. Until then, the current pattern is likely to be viewed as corrective and part of the ongoing consolidation phase.


© 2000-2026. Уcі права захищені.
Cайт знаходитьcя під керуванням TeleTrade DJ. LLC 2351 LLC 2022 (Euro House, Richmond Hill Road, Kingstown, VC0100, St. Vincent and the Grenadines).
Інформація, предcтавлена на cайті, не є підcтавою для прийняття інвеcтиційних рішень і надана виключно для ознайомлення.
Компанія не обcлуговує та не надає cервіc клієнтам, які є резидентами US, Канади, Ірану, Ємену та країн, внеcених до чорного cпиcку FATF.
Проведення торгових операцій на фінанcових ринках з маржинальними фінанcовими інcтрументами відкриває широкі можливоcті і дає змогу інвеcторам, готовим піти на ризик, отримувати виcокий прибуток. Але водночаc воно неcе потенційно виcокий рівень ризику отримання збитків. Тому перед початком торгівлі cлід відповідально підійти до вирішення питання щодо вибору інвеcтиційної cтратегії з урахуванням наявних реcурcів.
Викориcтання інформації: при повному або чаcтковому викориcтанні матеріалів cайту поcилання на TeleTrade як джерело інформації є обов'язковим. Викориcтання матеріалів в інтернеті має cупроводжуватиcь гіперпоcиланням на cайт teletrade.org. Автоматичний імпорт матеріалів та інформації із cайту заборонено.
З уcіх питань звертайтеcь за адреcою pr@teletrade.global.
переклади