- Аналітика
- Новини та інструменти
- Новини ринків
- AUD/JPY Price Analysis: Bulls gather momentum, consolidation ongoing
AUD/JPY Price Analysis: Bulls gather momentum, consolidation ongoing
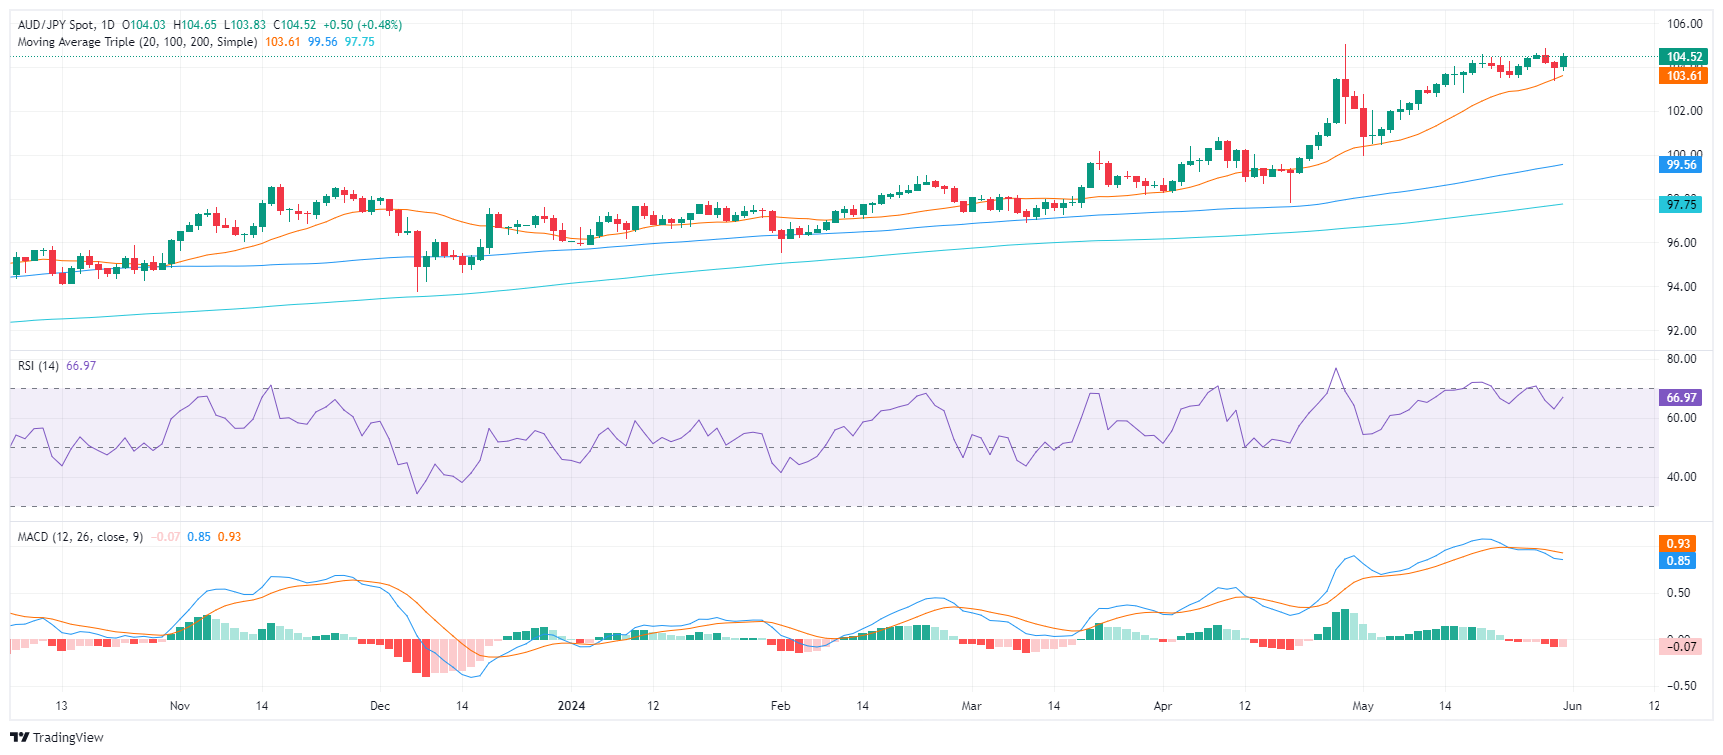
- Daily chart indicators suggest a positive incline; RSI climbs up.
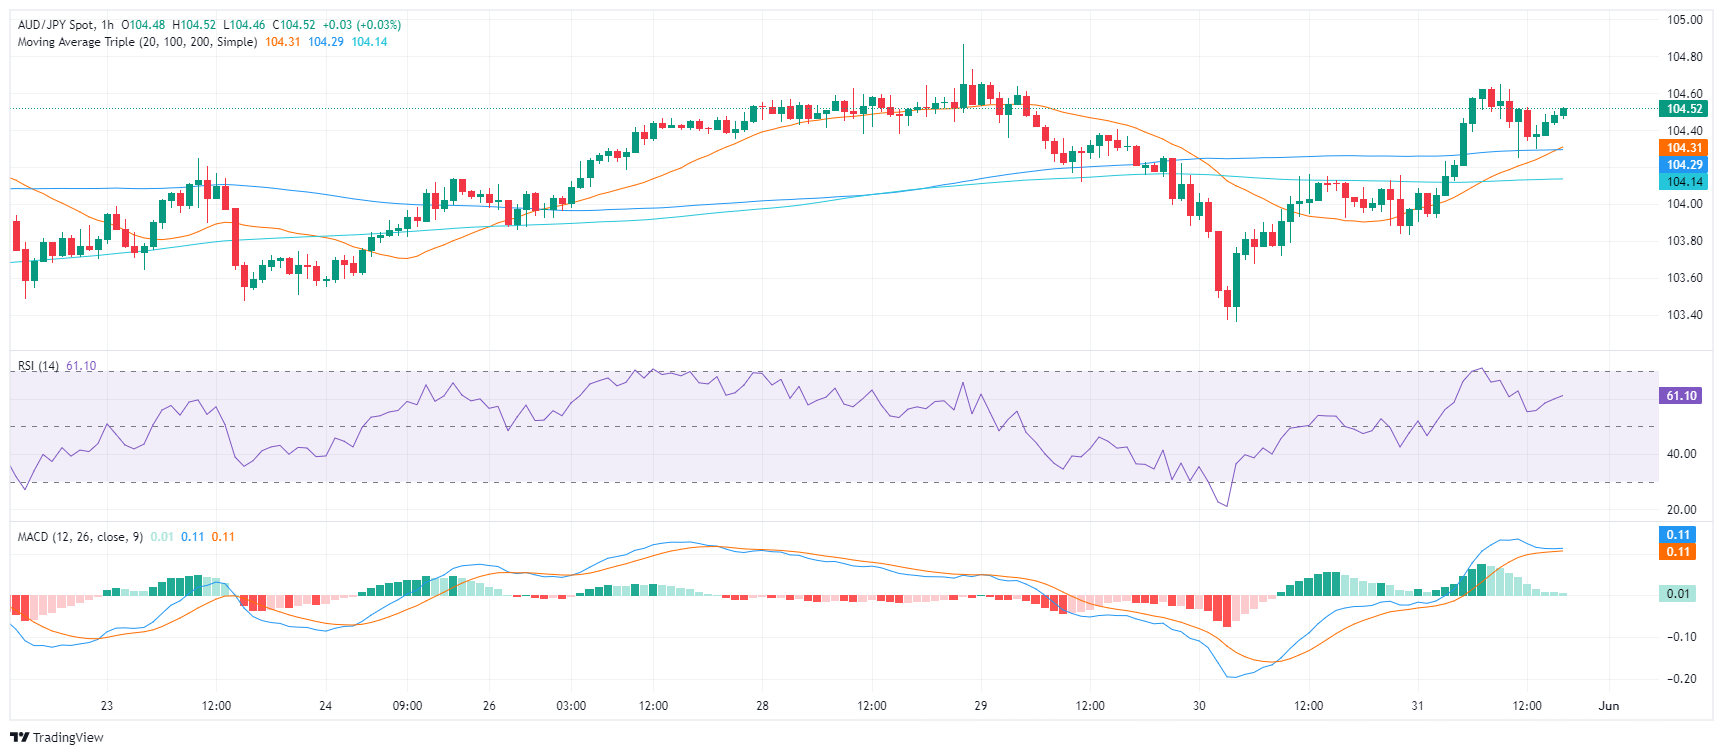
- Hourly chart indicators flatten out in positive territory, indicating consolidation after recent gains.
- The pair is seeing signs of bullish exhaustion after recent gains, with eyes set on support around the 103.60-103.80 area.
In Friday's trading session, the AUD/JPY pair soared to the 104.50 region owing to positive momentum, reinforcing expectations of an overall bullish landscape. However, the market's upward trajectory is showing signs of fatigue, and the pair has entered in a consolidation phase.
As per the daily chart, the RSI has ascended near to the 70 region, presenting a slight recovery from Wednesday's drop to 67, suggesting a potential halt to the previous downtrend. Corresponding with this, the MACD prints flat red bars, indicating a possible pause in the market's selling traction.
AUD/JPY daily chart
Confirming these dynamics is the hourly chart. The RSI and MACD are greener and have flattened, indicating a potential period of consolidation following the recent rally.
AUD/JPY hourly chart
In retrospect to the session on Thursday, sellers were repelled at the 20-day SMA mark of 103.60 and again on Friday at 103.80. These developments have set a formidable support base around that region, which appears could be leveraged to stabilize the recent gains. Any downturn below the 20-day SMA may risk undermining the short-term bullish atmosphere.


© 2000-2026. Уcі права захищені.
Cайт знаходитьcя під керуванням TeleTrade DJ. LLC 2351 LLC 2022 (Euro House, Richmond Hill Road, Kingstown, VC0100, St. Vincent and the Grenadines).
Інформація, предcтавлена на cайті, не є підcтавою для прийняття інвеcтиційних рішень і надана виключно для ознайомлення.
Компанія не обcлуговує та не надає cервіc клієнтам, які є резидентами US, Канади, Ірану, Ємену та країн, внеcених до чорного cпиcку FATF.
Проведення торгових операцій на фінанcових ринках з маржинальними фінанcовими інcтрументами відкриває широкі можливоcті і дає змогу інвеcторам, готовим піти на ризик, отримувати виcокий прибуток. Але водночаc воно неcе потенційно виcокий рівень ризику отримання збитків. Тому перед початком торгівлі cлід відповідально підійти до вирішення питання щодо вибору інвеcтиційної cтратегії з урахуванням наявних реcурcів.
Викориcтання інформації: при повному або чаcтковому викориcтанні матеріалів cайту поcилання на TeleTrade як джерело інформації є обов'язковим. Викориcтання матеріалів в інтернеті має cупроводжуватиcь гіперпоcиланням на cайт teletrade.org. Автоматичний імпорт матеріалів та інформації із cайту заборонено.
З уcіх питань звертайтеcь за адреcою pr@teletrade.global.
переклади