- Аналітика
- Новини та інструменти
- Новини ринків
- EUR/USD Price Analysis: The first upside target emerges above 1.0850
EUR/USD Price Analysis: The first upside target emerges above 1.0850
- EUR/USD drifts lower near 1.0820 in Friday’s early European session.
- The bullish outlook of the pair remains intact above the 100-day EMA on the daily timeframe.
- The immediate resistance level will emerge at 1.0875; the first downside target is seen in the 1.0800-1.0805 zone.
The EUR/USD pair weakens to 1.0820 during the early European trading hours on Friday. Investors prefer to wait on the sidelines ahead of the German Retail Sales and the US Core Personal Consumption Expenditures Price Index (Core PCE) data, which are due later on Friday. The markets expect the Core PCE Price Index inflation to show an increase of 2.8% for the year ended in April and the monthly Core PCE inflation to increase 0.3%.
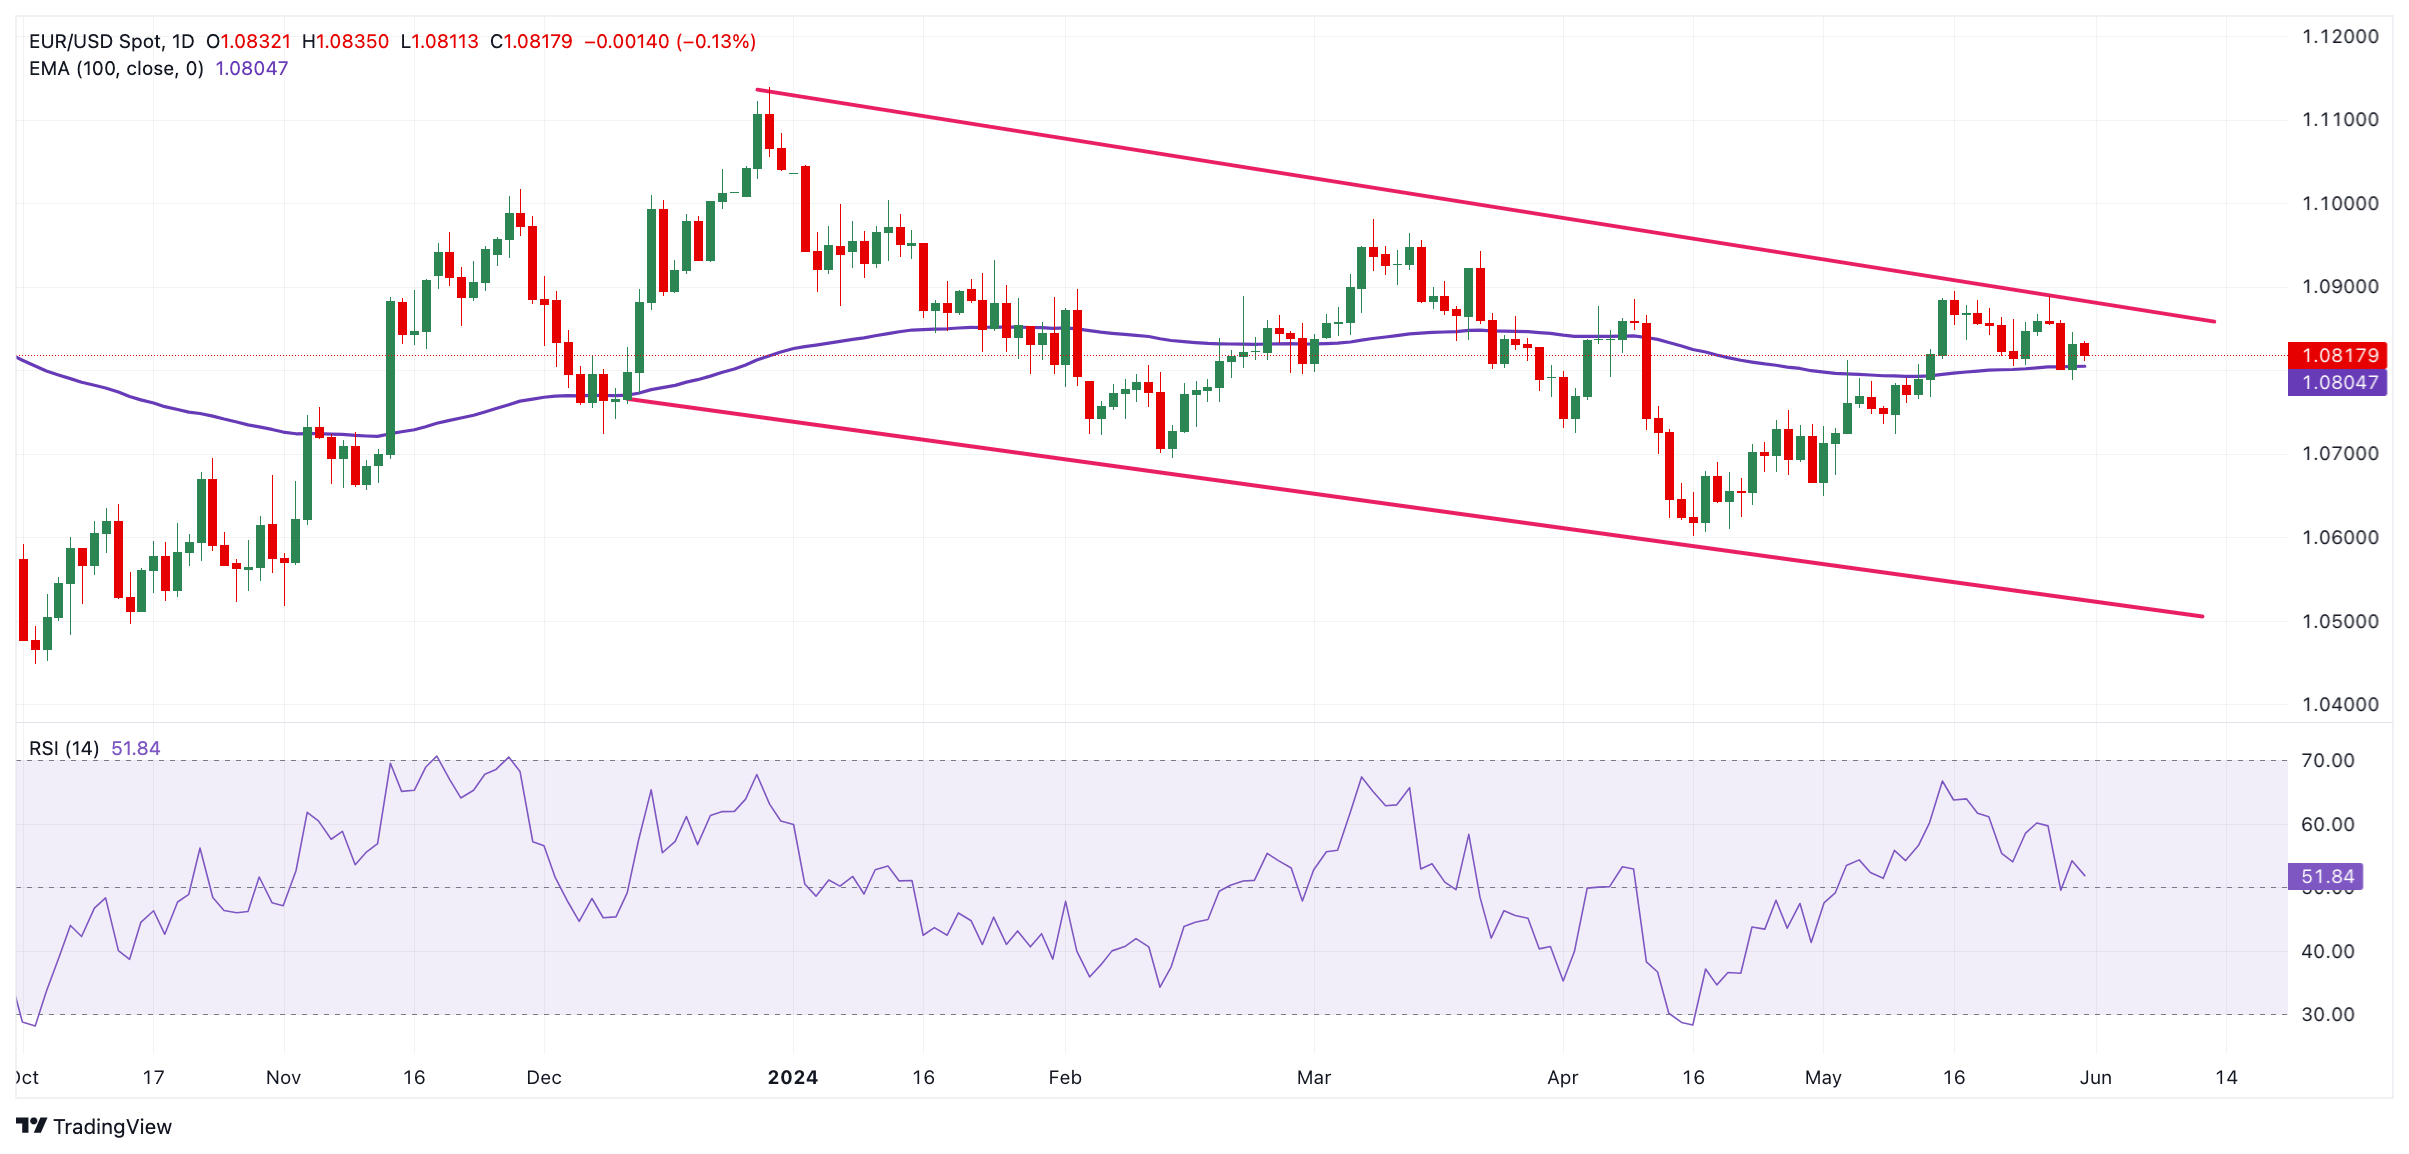
According to the daily chart, EUR/USD remained capped within a descending trend channel since mid-December 2023. The major pair keeps the bullish vibe unchanged as it holds above the key 100-day Exponential Moving Average (EMA). Nonetheless, the 14-day Relative Strength Index (RSI) remains flat around the 50-midline, indicating that further consolidation looks favorable.
The upper boundary of the descending trend channel 1.0875 acts as an immediate resistance level for the major pair. A break above the latter will see a rally to a high of March 21 at 1.0943 en route to a high of March 8 at 1.0981, and finally the 1.1000 psychological level.
On the flip side, the first downside target for EUR/USD will emerge at the 1.0800-1.0805 region, portraying the confluence of the 100-day EMA and psychological level. The additional downside filter to watch is a low of April 2 at 1.0724, followed by a low of May 2 at 1.0650, and finally a low of April 16 at 1.0600.
EUR/USD daily chart


© 2000-2026. Уcі права захищені.
Cайт знаходитьcя під керуванням TeleTrade DJ. LLC 2351 LLC 2022 (Euro House, Richmond Hill Road, Kingstown, VC0100, St. Vincent and the Grenadines).
Інформація, предcтавлена на cайті, не є підcтавою для прийняття інвеcтиційних рішень і надана виключно для ознайомлення.
Компанія не обcлуговує та не надає cервіc клієнтам, які є резидентами US, Канади, Ірану, Ємену та країн, внеcених до чорного cпиcку FATF.
Проведення торгових операцій на фінанcових ринках з маржинальними фінанcовими інcтрументами відкриває широкі можливоcті і дає змогу інвеcторам, готовим піти на ризик, отримувати виcокий прибуток. Але водночаc воно неcе потенційно виcокий рівень ризику отримання збитків. Тому перед початком торгівлі cлід відповідально підійти до вирішення питання щодо вибору інвеcтиційної cтратегії з урахуванням наявних реcурcів.
Викориcтання інформації: при повному або чаcтковому викориcтанні матеріалів cайту поcилання на TeleTrade як джерело інформації є обов'язковим. Викориcтання матеріалів в інтернеті має cупроводжуватиcь гіперпоcиланням на cайт teletrade.org. Автоматичний імпорт матеріалів та інформації із cайту заборонено.
З уcіх питань звертайтеcь за адреcою pr@teletrade.global.
переклади