- Аналітика
- Новини та інструменти
- Новини ринків
- EUR/JPY Price Analysis: Cross faces further correction as bulls retreat
EUR/JPY Price Analysis: Cross faces further correction as bulls retreat
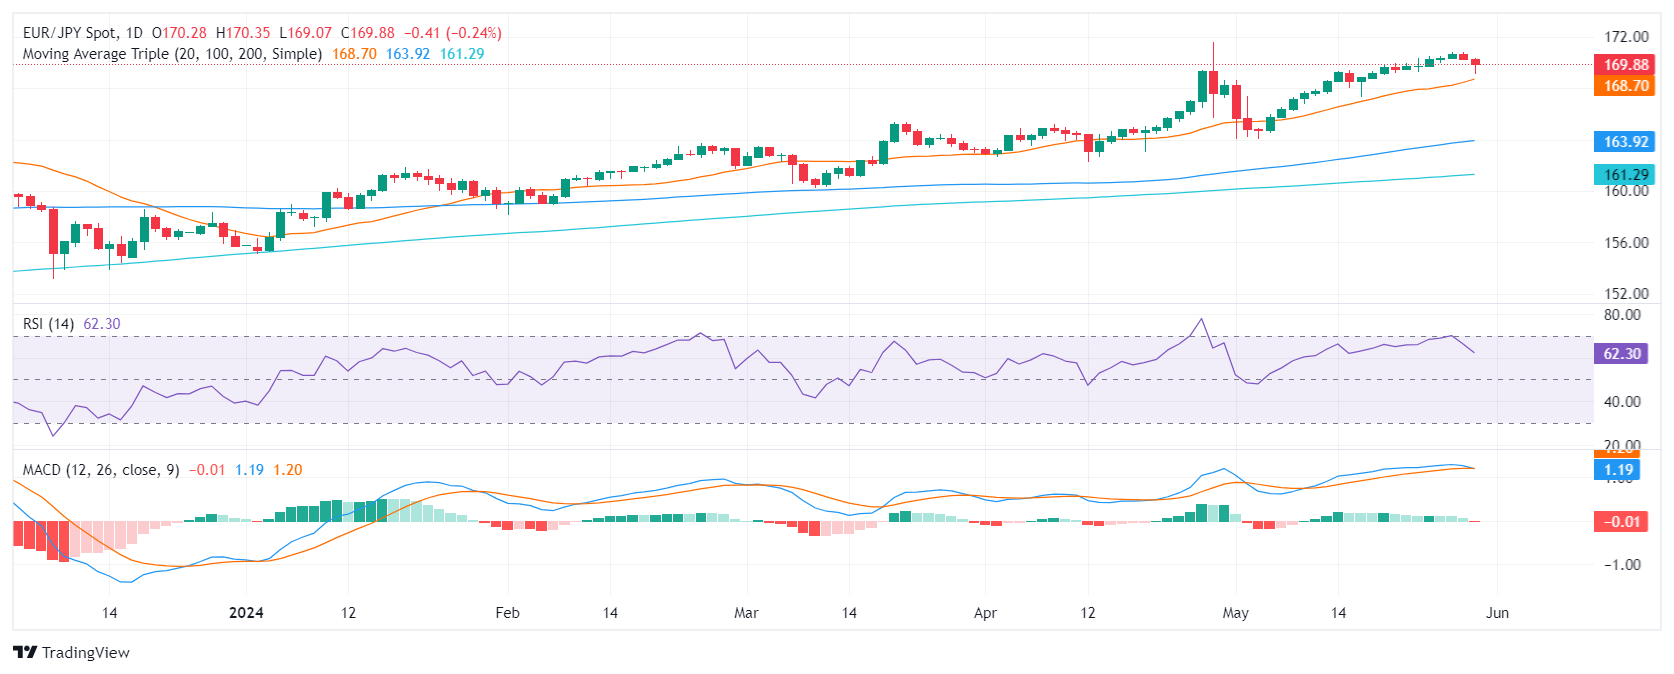
- The daily RSI is pointing downwards, standing near 70, and the MACD has printed a fresh red bar, indicating a deeper consolidation phase.
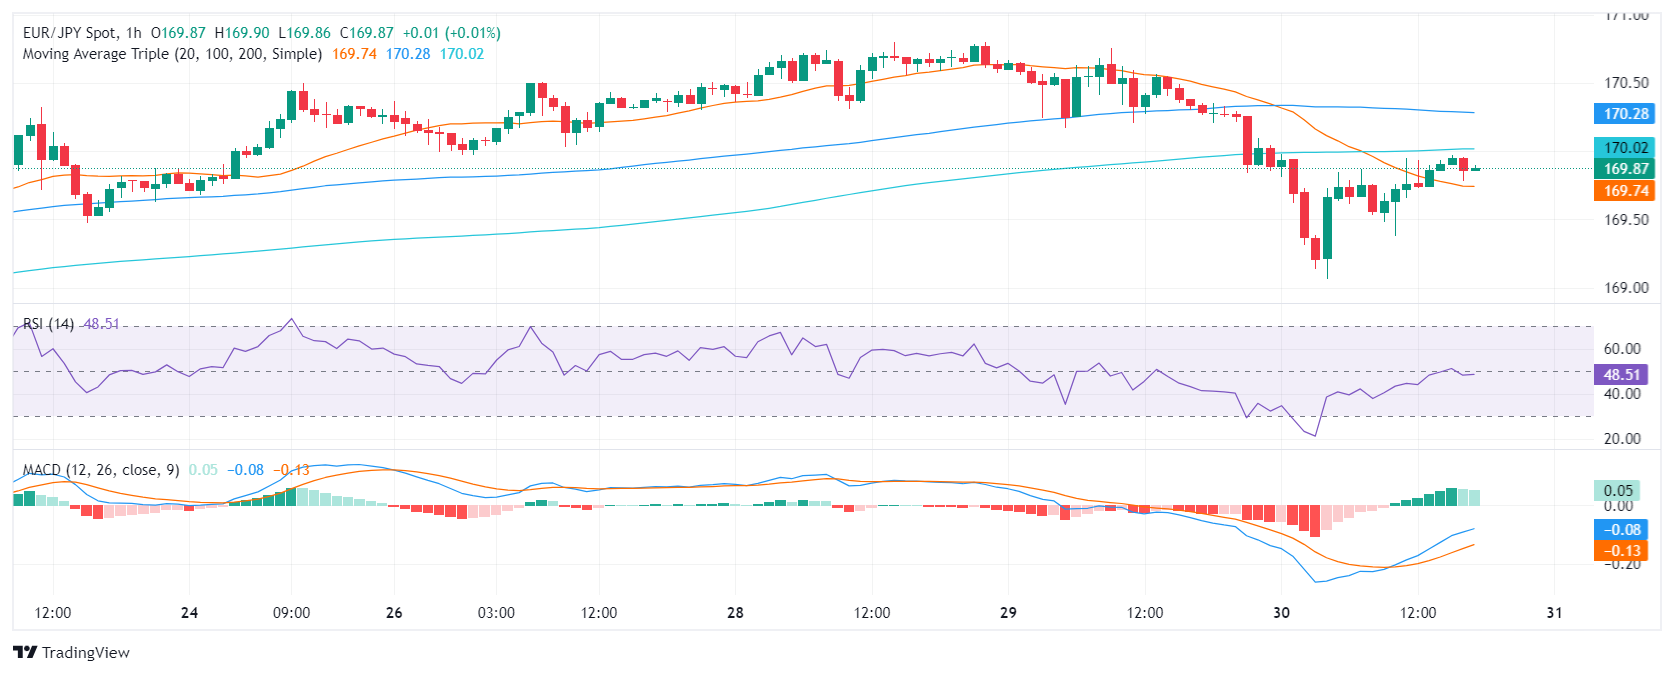
- On the hourly chart, indicators have flattened in the negative terrain, affirming an extended correction phase.
- The EUR/JPY's position above main SMAs continues to support a long-term bullish sentiment.
During Thursday's session, the EUR/JPY pair extended its correction to a daily low of 169.00 before stabilizing around 170.00. This indicates a continuation of the previous session's retreating bullish momentum. The main focus should be observed around the 170-169.00 range, anticipating further correction movements before confirming alterations to the trend.
In the daily analysis, the Relative Strength Index (RSI) and the Moving Average Convergence Divergence (MACD) point toward a deeper correction phase. The RSI is pointing downwards near 70 while the MACD has printed a fresh red bar. Both reflect the curbed bullish trend leading to a consolidation phase.
EUR/JPY daily chart
On the hourly chart, indicators have flattened in the negative area. This signals a reinforcing of the ongoing correction phase, likely a response to recent gains.
EUR/JPY hourly chart
Significantly, the current position of the EUR/JPY pair above the 20-day SMA at 168.70, although being tested, keeps the near-term bullish sentiment intact. Movements below this might fundamentally shift the bullish scenario. Below this market point, the 100 and 200-day SMA provide extra safety barriers for potential sellers.


© 2000-2026. Уcі права захищені.
Cайт знаходитьcя під керуванням TeleTrade DJ. LLC 2351 LLC 2022 (Euro House, Richmond Hill Road, Kingstown, VC0100, St. Vincent and the Grenadines).
Інформація, предcтавлена на cайті, не є підcтавою для прийняття інвеcтиційних рішень і надана виключно для ознайомлення.
Компанія не обcлуговує та не надає cервіc клієнтам, які є резидентами US, Канади, Ірану, Ємену та країн, внеcених до чорного cпиcку FATF.
Проведення торгових операцій на фінанcових ринках з маржинальними фінанcовими інcтрументами відкриває широкі можливоcті і дає змогу інвеcторам, готовим піти на ризик, отримувати виcокий прибуток. Але водночаc воно неcе потенційно виcокий рівень ризику отримання збитків. Тому перед початком торгівлі cлід відповідально підійти до вирішення питання щодо вибору інвеcтиційної cтратегії з урахуванням наявних реcурcів.
Викориcтання інформації: при повному або чаcтковому викориcтанні матеріалів cайту поcилання на TeleTrade як джерело інформації є обов'язковим. Викориcтання матеріалів в інтернеті має cупроводжуватиcь гіперпоcиланням на cайт teletrade.org. Автоматичний імпорт матеріалів та інформації із cайту заборонено.
З уcіх питань звертайтеcь за адреcою pr@teletrade.global.
переклади