- Аналітика
- Новини та інструменти
- Новини ринків
- USD/JPY Price Analysis: Slips below 157.00 as bearish engulfing pattern looms
USD/JPY Price Analysis: Slips below 157.00 as bearish engulfing pattern looms
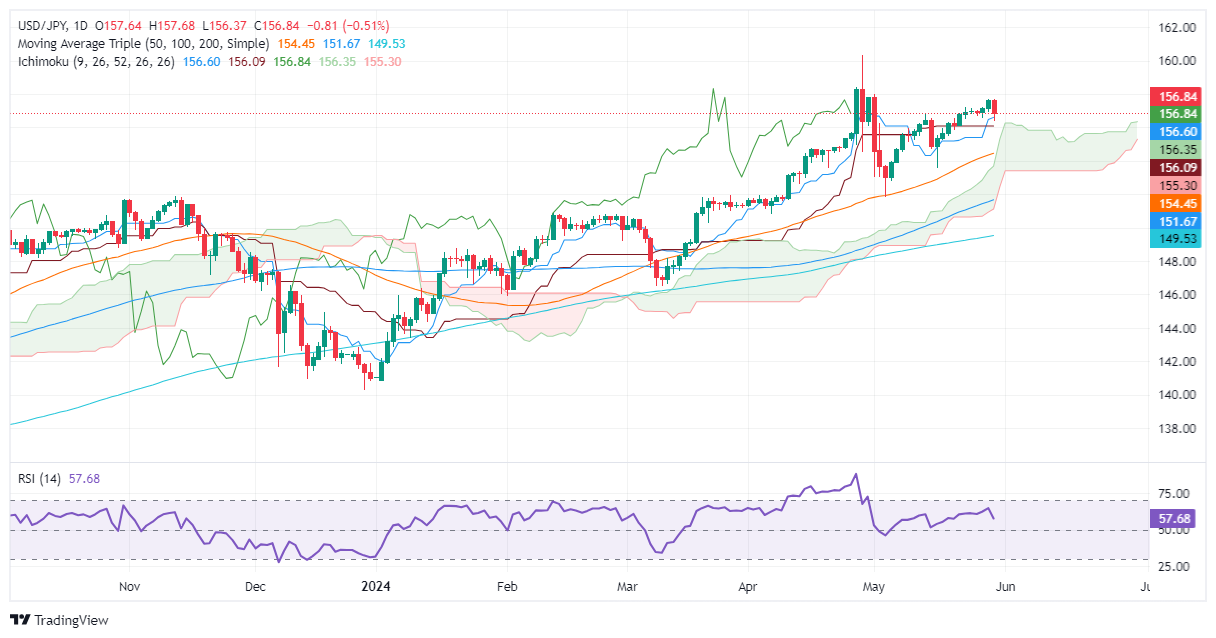
- USD/JPY slips from weekly highs of 157.71, down 0.30%.
- Technical outlook remains neutral to upward, with key resistance at 157.00 and 157.71.
- Support levels to watch: Tenkan and Kijun-Sen at 156.76/60, Senkou Span A at 156.32, and 156.00 mark.
The USD/JPY dropped from weekly highs of 157.71 on May 29 after data from the United States (US) painted an ongoing economic slowdown, which sent US Treasury yields plunging. Consequently, the Greenback is feeling the pain, as the pair is trading at 156.83, down 0.30%.
USD/JPY Price Analysis: Technical outlook
The major remains neutral to upward bias after cracking the May 14 high of 156.76. That opened the door to challenge 157.00 and beyond, but the drop in the US 10-year yield, which correlates closely to the USD/JPY, weighed on the pair.
Momentum suggests that buyers remain in charge, as the Relative Strength Index (RSI) is bullish but aiming down.
If USD/JPY buyers reclaim 157.00, that could pave the way for further gains and expose overhead resistance at the current week’s high of 157.71. Once hurdled, the next stop would be 158.00, followed by the year-to-date (YTD) high of 160.32.
On the flip side, sellers could push the exchange rate as a ‘bearish engulfing’ chart pattern loom. A drop below the Tenkan and Kijun-Sen at around 156.76/60 will sponsor a leg down. The next line of defense for bulls would be the Senkou Span A at 156.32 before challenging the 156.00 mark.
USD/JPY Price Action – Daily Chart


© 2000-2026. Уcі права захищені.
Cайт знаходитьcя під керуванням TeleTrade DJ. LLC 2351 LLC 2022 (Euro House, Richmond Hill Road, Kingstown, VC0100, St. Vincent and the Grenadines).
Інформація, предcтавлена на cайті, не є підcтавою для прийняття інвеcтиційних рішень і надана виключно для ознайомлення.
Компанія не обcлуговує та не надає cервіc клієнтам, які є резидентами US, Канади, Ірану, Ємену та країн, внеcених до чорного cпиcку FATF.
Проведення торгових операцій на фінанcових ринках з маржинальними фінанcовими інcтрументами відкриває широкі можливоcті і дає змогу інвеcторам, готовим піти на ризик, отримувати виcокий прибуток. Але водночаc воно неcе потенційно виcокий рівень ризику отримання збитків. Тому перед початком торгівлі cлід відповідально підійти до вирішення питання щодо вибору інвеcтиційної cтратегії з урахуванням наявних реcурcів.
Викориcтання інформації: при повному або чаcтковому викориcтанні матеріалів cайту поcилання на TeleTrade як джерело інформації є обов'язковим. Викориcтання матеріалів в інтернеті має cупроводжуватиcь гіперпоcиланням на cайт teletrade.org. Автоматичний імпорт матеріалів та інформації із cайту заборонено.
З уcіх питань звертайтеcь за адреcою pr@teletrade.global.
переклади