- Аналітика
- Новини та інструменти
- Новини ринків
- AUD/JPY Price Analysis: Breaks below 104.00, followed by support at 14-day EMA
AUD/JPY Price Analysis: Breaks below 104.00, followed by support at 14-day EMA
- AUD/JPY could test the key level of 104.00, followed by the upper boundary of the ascending triangle.
- The momentum indicator 14-day RSI suggests the confirmation of the bullish bias for the pair.
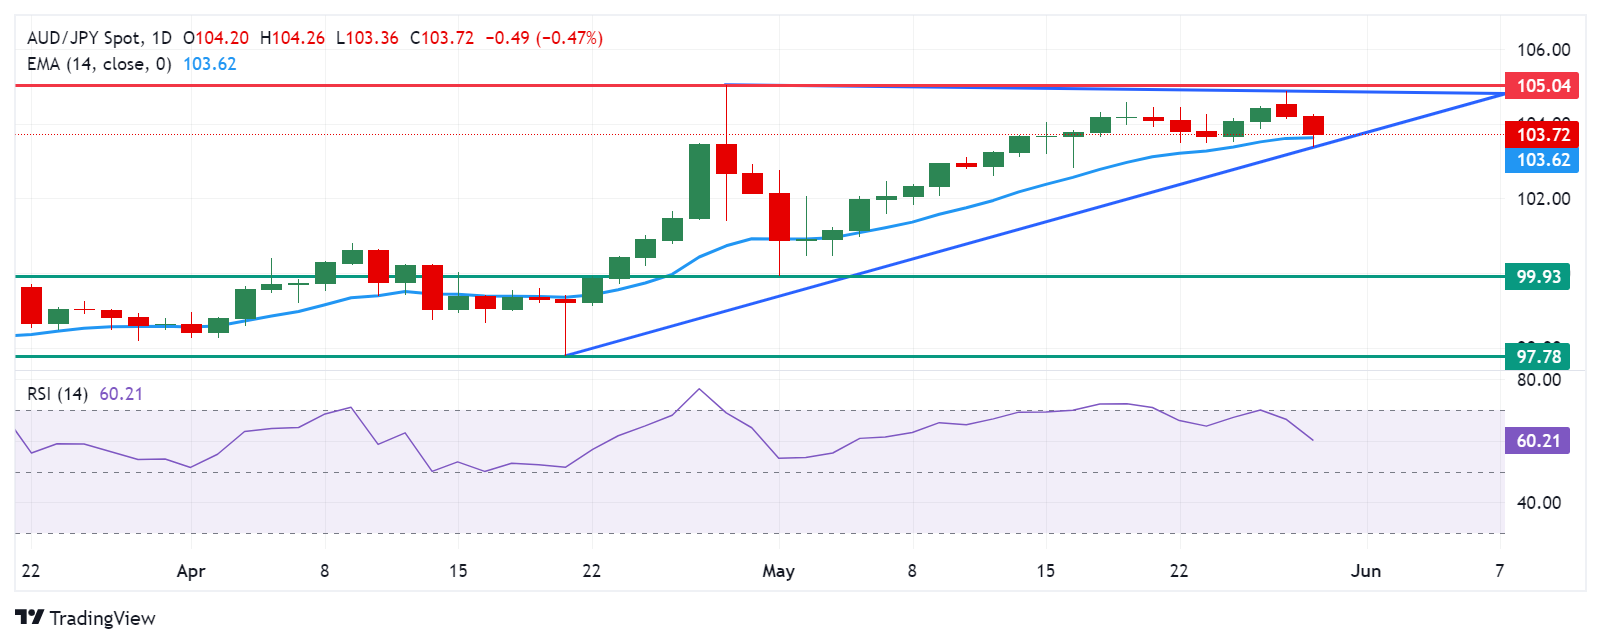
- The immediate support appears around the 14-day EMA at 103.63 and the lower threshold of the ascending triangle.
AUD/JPY extends its losses to near 103.80 during European trading hours on Thursday. However, the analysis of the daily chart indicates a bullish bias for the AUD/JPY pair, as it remains within an ascending triangle. Furthermore, the momentum indicator 14-day Relative Strength Index (RSI) is above the 50 level, suggesting confirmation of the bullish outlook.
The AUD/JPY cross could test the immediate resistance at the psychological level of 104.00, followed by the upper boundary of the ascending triangle around 104.80. A breakthrough above this level could reinforce the bullish sentiment, potentially pushing the cross past the psychological level of 105.00, aligning with the highest level of 105.04, which has not been seen since April 2013.
On the downside, the 14-day Exponential Moving Average (EMA) at 103.62 serves as immediate support for the AUD/JPY cross, followed by the lower threshold of the ascending triangle around the key level of 103.50.
A break below the latter could lead the AUD/JPY cross to navigate the region around the psychological level of 100.00 and the throwback support at 99.93. Further decline could exert downward pressure on the cross, potentially driving it toward April's low of 97.78.
AUD/JPY: Daily Chart


© 2000-2026. Уcі права захищені.
Cайт знаходитьcя під керуванням TeleTrade DJ. LLC 2351 LLC 2022 (Euro House, Richmond Hill Road, Kingstown, VC0100, St. Vincent and the Grenadines).
Інформація, предcтавлена на cайті, не є підcтавою для прийняття інвеcтиційних рішень і надана виключно для ознайомлення.
Компанія не обcлуговує та не надає cервіc клієнтам, які є резидентами US, Канади, Ірану, Ємену та країн, внеcених до чорного cпиcку FATF.
Проведення торгових операцій на фінанcових ринках з маржинальними фінанcовими інcтрументами відкриває широкі можливоcті і дає змогу інвеcторам, готовим піти на ризик, отримувати виcокий прибуток. Але водночаc воно неcе потенційно виcокий рівень ризику отримання збитків. Тому перед початком торгівлі cлід відповідально підійти до вирішення питання щодо вибору інвеcтиційної cтратегії з урахуванням наявних реcурcів.
Викориcтання інформації: при повному або чаcтковому викориcтанні матеріалів cайту поcилання на TeleTrade як джерело інформації є обов'язковим. Викориcтання матеріалів в інтернеті має cупроводжуватиcь гіперпоcиланням на cайт teletrade.org. Автоматичний імпорт матеріалів та інформації із cайту заборонено.
З уcіх питань звертайтеcь за адреcою pr@teletrade.global.
переклади