- Аналітика
- Новини та інструменти
- Новини ринків
- NZD/JPY Price Analysis: Bullish momentum adjusts, correction begins following overbought signals
NZD/JPY Price Analysis: Bullish momentum adjusts, correction begins following overbought signals
- The daily chart continues to flash overbought signals despite a slight correction, with the overall uptrend still intact.
- Despite a minor dip to 96.40, NZD/JPY remains near its multi-year peak.
- The critical support level for the pair remains firmly at 95.00, marking a pivotal level to ward off losses.
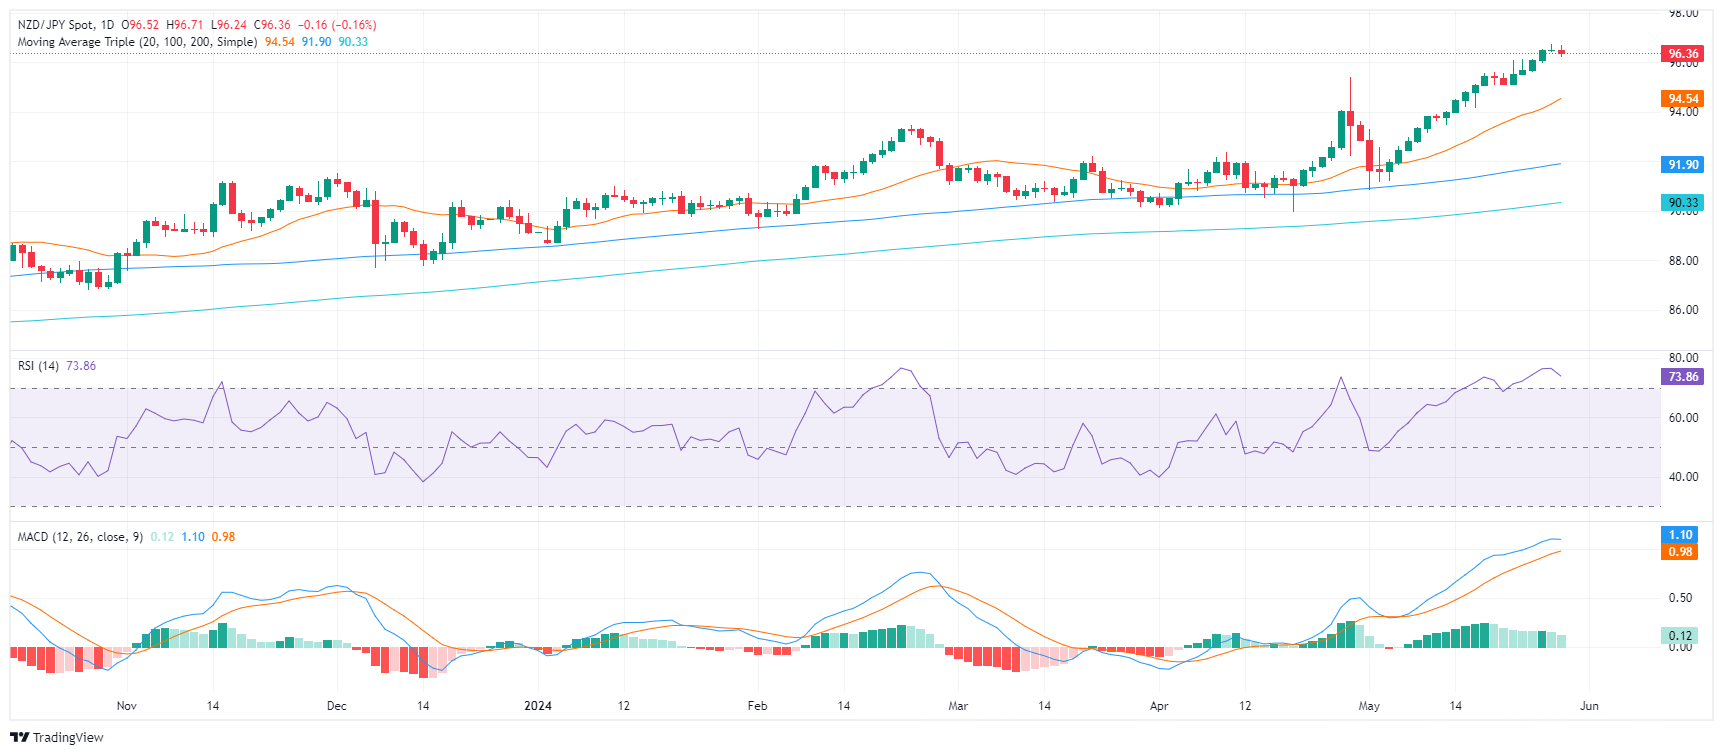
In Wednesday's session, the NZD/JPY pair saw a small correction to 96.40 but remains at its highest level since July 2007 at around 96.70. This adjustment doesn't quite alter the current outlook, merely turning it slightly cautious given the persistent overbought signals, but the overarching bullish trend carries on.
The daily chart's indicators confirm this narrative where the Relative Strength Index (RSI) remains in a deep overbought condition. Meanwhile, the Moving Average Convergence Divergence (MACD) keeps showing sustained positive momentum with its consistent green bars.
NZD/JPY daily chart
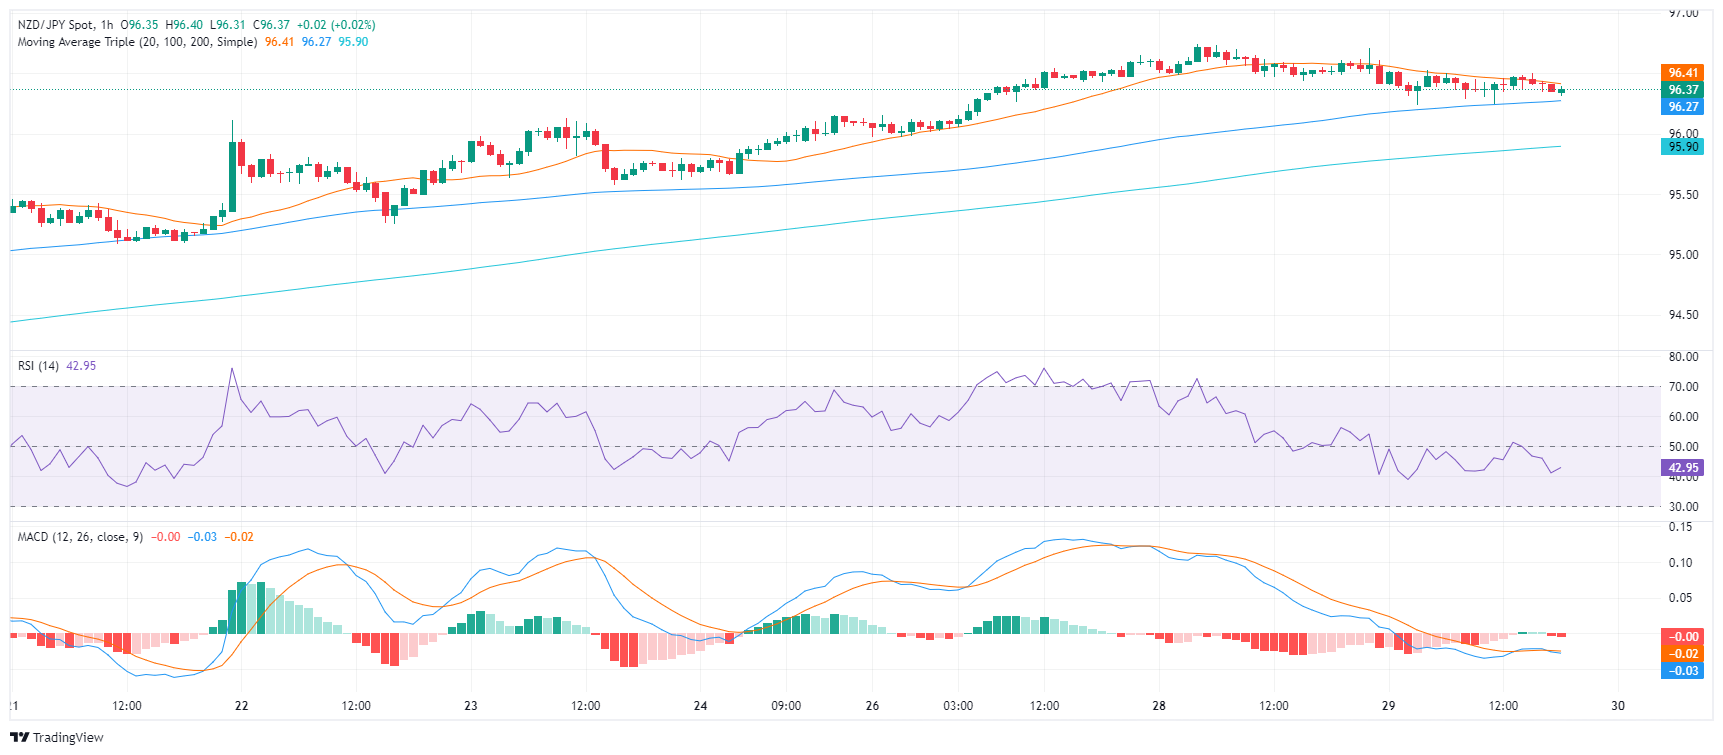
On the hourly chart, there is a visible weakening of strength compared to the daily perspective, and an ongoing edging downward can be observed.
NZD/JPY hourly chart
In a broader context, the NZD/JPY continues to display a strong uptrend, as shown by its position above the 20, 100, and 200-day Simple Moving Averages (SMA). Despite the slight correction, the pair's short-term gains still overshadow its medium and long-term averages.
As the looming correction gains momentum, any further downward movements should ideally keep the pair above its SMAs. Crucial to the monitoring is the first strong support level observed at 95.00, which the pair could potentially use to cushion any significant losses.


© 2000-2026. Уcі права захищені.
Cайт знаходитьcя під керуванням TeleTrade DJ. LLC 2351 LLC 2022 (Euro House, Richmond Hill Road, Kingstown, VC0100, St. Vincent and the Grenadines).
Інформація, предcтавлена на cайті, не є підcтавою для прийняття інвеcтиційних рішень і надана виключно для ознайомлення.
Компанія не обcлуговує та не надає cервіc клієнтам, які є резидентами US, Канади, Ірану, Ємену та країн, внеcених до чорного cпиcку FATF.
Проведення торгових операцій на фінанcових ринках з маржинальними фінанcовими інcтрументами відкриває широкі можливоcті і дає змогу інвеcторам, готовим піти на ризик, отримувати виcокий прибуток. Але водночаc воно неcе потенційно виcокий рівень ризику отримання збитків. Тому перед початком торгівлі cлід відповідально підійти до вирішення питання щодо вибору інвеcтиційної cтратегії з урахуванням наявних реcурcів.
Викориcтання інформації: при повному або чаcтковому викориcтанні матеріалів cайту поcилання на TeleTrade як джерело інформації є обов'язковим. Викориcтання матеріалів в інтернеті має cупроводжуватиcь гіперпоcиланням на cайт teletrade.org. Автоматичний імпорт матеріалів та інформації із cайту заборонено.
З уcіх питань звертайтеcь за адреcою pr@teletrade.global.
переклади