- Аналітика
- Новини та інструменти
- Новини ринків
- EUR/JPY Price Analysis: Consolidation phase imminent as bulls retreat
EUR/JPY Price Analysis: Consolidation phase imminent as bulls retreat
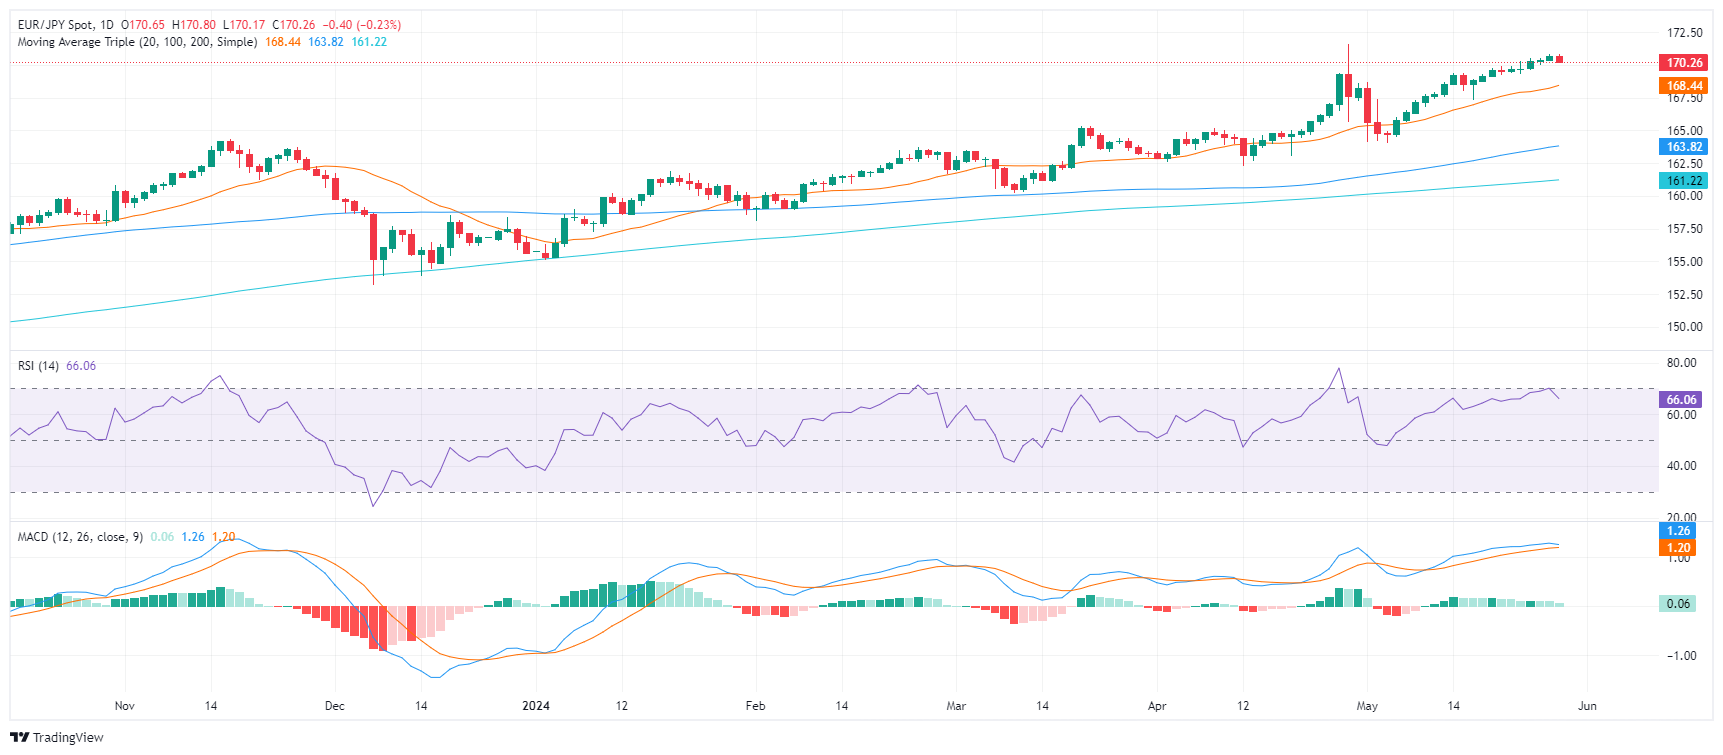
- The daily RSI and MACD are edging downwards but remain in positive territory hinting at a possible consolidation phase that could be brief.
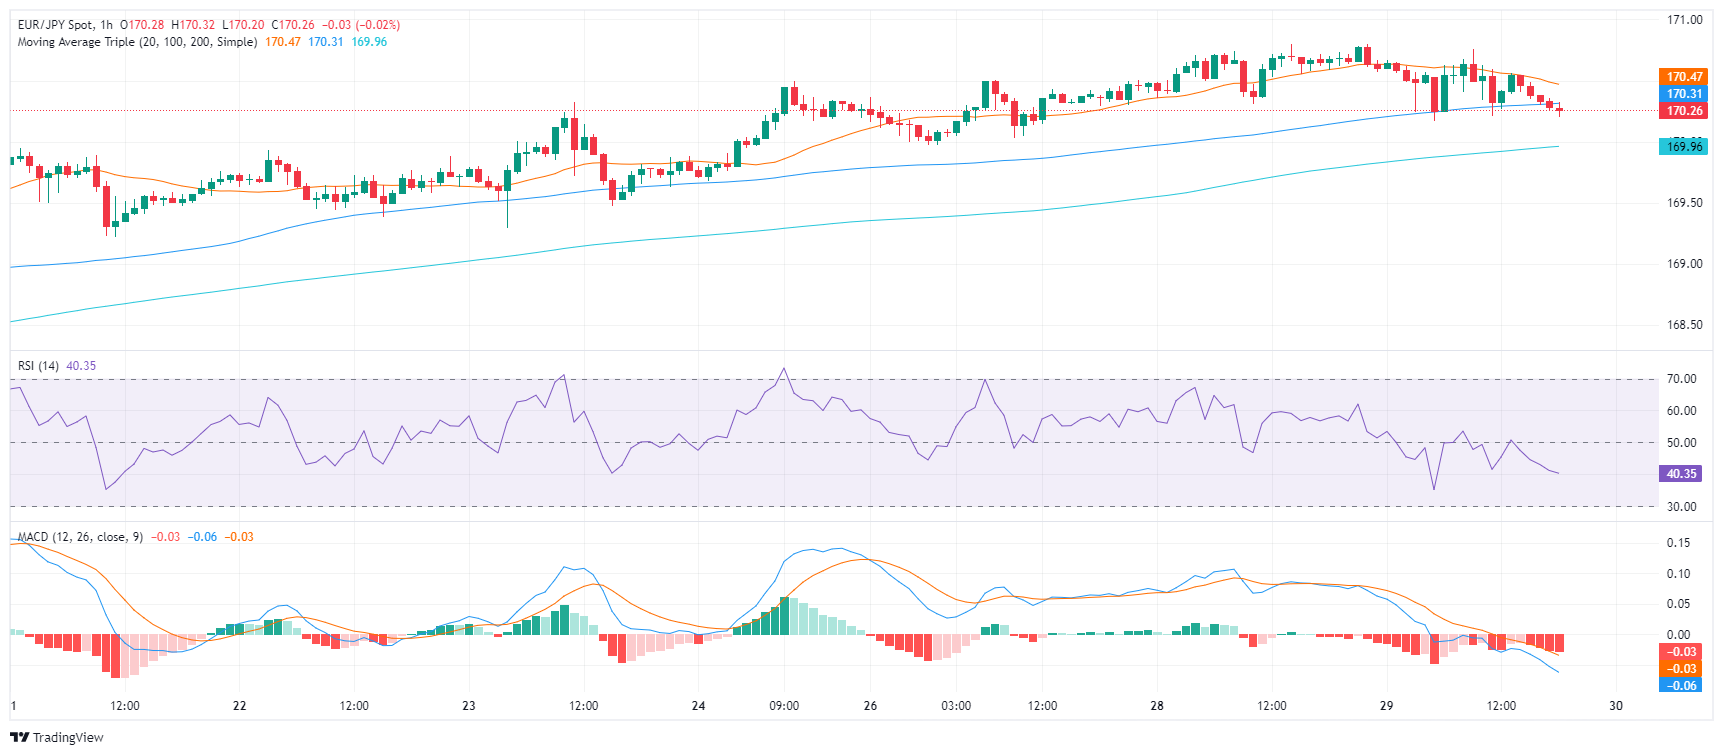
- On the hourly chart, indicators have shifted into the negative zone, further pointing towards an ongoing correction phase.
- The EUR/JPY's position above main SMAs keeps a long-term bullish sentiment alive despite the recent pullback.
In Wednesday's session, the EUR/JPY pair retreated slightly to 170.29, demonstrating an immediate dampening of the bullish momentum. However, since it remains close to cycle highs of 171.60, the consolidation period might not last long. Traders should observe the 170-168.00 range for potential correction movements before affirming changes to the outlook.
In the daily analysis, the Relative Strength Index (RSI) and the Moving Average Convergence Divergence (MACD) indicate a slight downward movement but still remain in the positive region. Both demonstrate the stopped short bullish trend which may lead to a short consolidation phase.
EUR/JPY daily chart
On the hourly chart, both RSI and MACD have now edged into the negative zone, corroborating with the indication of an ongoing corrective phase, which is likely response to recent gains.
EUR/JPY hourly chart
Notably, the current position of the EUR/JPY pair above the 20-day SMA at 168.45, though threatened, maintains the short-term bullish sentiment. Any movements below this could, however, fundamentally shift the bullish scenario. Below it, the 100 and 200-day SMA offer additional supportive barriers in case sellers come in strong.


© 2000-2026. Уcі права захищені.
Cайт знаходитьcя під керуванням TeleTrade DJ. LLC 2351 LLC 2022 (Euro House, Richmond Hill Road, Kingstown, VC0100, St. Vincent and the Grenadines).
Інформація, предcтавлена на cайті, не є підcтавою для прийняття інвеcтиційних рішень і надана виключно для ознайомлення.
Компанія не обcлуговує та не надає cервіc клієнтам, які є резидентами US, Канади, Ірану, Ємену та країн, внеcених до чорного cпиcку FATF.
Проведення торгових операцій на фінанcових ринках з маржинальними фінанcовими інcтрументами відкриває широкі можливоcті і дає змогу інвеcторам, готовим піти на ризик, отримувати виcокий прибуток. Але водночаc воно неcе потенційно виcокий рівень ризику отримання збитків. Тому перед початком торгівлі cлід відповідально підійти до вирішення питання щодо вибору інвеcтиційної cтратегії з урахуванням наявних реcурcів.
Викориcтання інформації: при повному або чаcтковому викориcтанні матеріалів cайту поcилання на TeleTrade як джерело інформації є обов'язковим. Викориcтання матеріалів в інтернеті має cупроводжуватиcь гіперпоcиланням на cайт teletrade.org. Автоматичний імпорт матеріалів та інформації із cайту заборонено.
З уcіх питань звертайтеcь за адреcою pr@teletrade.global.
переклади