- Аналітика
- Новини та інструменти
- Новини ринків
- AUD/NZD declines following higher inflation figures from Australia and soft ANZ data
AUD/NZD declines following higher inflation figures from Australia and soft ANZ data
- The AUD/NZD declines to a low of 1.0815 after reaching a high of 1.0850 on Wednesday.
- Australian high-tier data tempers RBA's dovish expectations, while soft New Zealand data renews RBNZ policy divergence.
- Following downbeat ANZ data, the market bets over higher odds of an RBNZ rate cut in November.
The AUD/NZD was seen trading lower during Wednesday's trading session, as markets digest high-tier data from both Australia and New Zealand.
In Australia, April's Consumer Price Indxe (CPI) came in hot at 3.6% YoY, surpassing the 3.4% expectations and the previous month's 3.5%. This marked the second consecutive month of acceleration and is the highest inflation rate since November. With core inflation remaining sticky above 4%, there are strong signals that the Reserve Bank of Australia (RBA) might turn its tone to a more hawkish one.
Meanwhile, the disappointing ANZ business survey data for May became a focal point in New Zealand. The Own Activity Outlook index dropped to a low of 11.8 from 14.3 in April, hinting towards weaker growth. Recently sticky domestic inflation led to the RBNZ discussing a potential rate increase which led to a significant strengthening of the Kiwi, markets are betting that the first cut will come in November of this year, priced in by 65%.
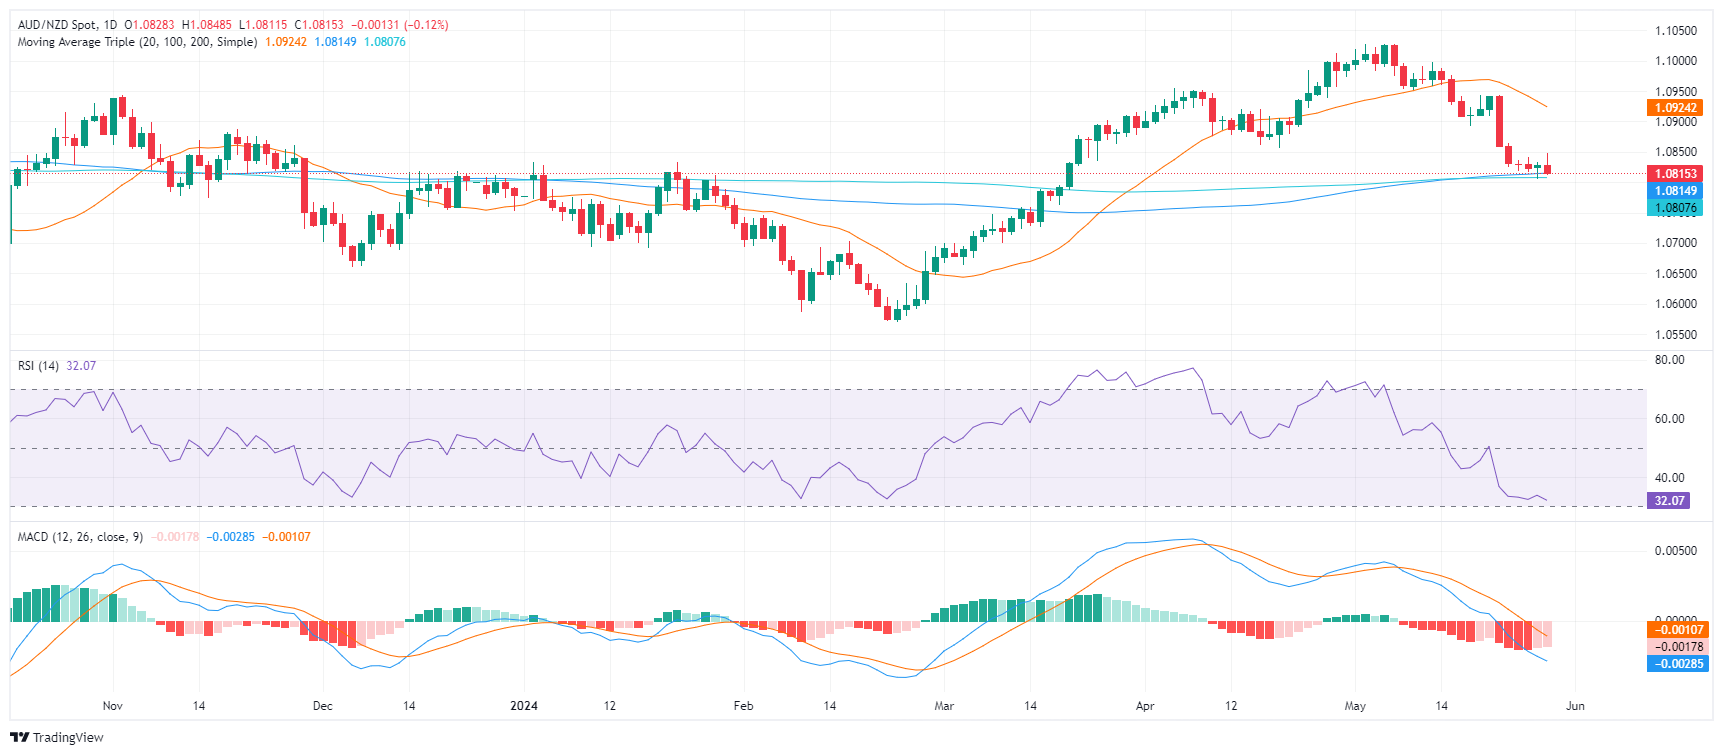
AUD/NZD technical analysis
On the daily chart, the Relative Strength Index (RSI) remains in negative territory, indicating a robust downtrend. This is consolidated by the rising red bars of the Moving Average Convergence Divergence (MACD) histogram, which confirms the continued downward momentum.
That being said, as the pair approached oversold terrain, the pair may see a slight upward correction in the next sessions.
AUD/NZD daily chart


© 2000-2026. Уcі права захищені.
Cайт знаходитьcя під керуванням TeleTrade DJ. LLC 2351 LLC 2022 (Euro House, Richmond Hill Road, Kingstown, VC0100, St. Vincent and the Grenadines).
Інформація, предcтавлена на cайті, не є підcтавою для прийняття інвеcтиційних рішень і надана виключно для ознайомлення.
Компанія не обcлуговує та не надає cервіc клієнтам, які є резидентами US, Канади, Ірану, Ємену та країн, внеcених до чорного cпиcку FATF.
Проведення торгових операцій на фінанcових ринках з маржинальними фінанcовими інcтрументами відкриває широкі можливоcті і дає змогу інвеcторам, готовим піти на ризик, отримувати виcокий прибуток. Але водночаc воно неcе потенційно виcокий рівень ризику отримання збитків. Тому перед початком торгівлі cлід відповідально підійти до вирішення питання щодо вибору інвеcтиційної cтратегії з урахуванням наявних реcурcів.
Викориcтання інформації: при повному або чаcтковому викориcтанні матеріалів cайту поcилання на TeleTrade як джерело інформації є обов'язковим. Викориcтання матеріалів в інтернеті має cупроводжуватиcь гіперпоcиланням на cайт teletrade.org. Автоматичний імпорт матеріалів та інформації із cайту заборонено.
З уcіх питань звертайтеcь за адреcою pr@teletrade.global.
переклади