- Аналітика
- Новини та інструменти
- Новини ринків
- GBP/USD Price Analysis: Slumps to fresh weekly lows as bears eye 1.2700
GBP/USD Price Analysis: Slumps to fresh weekly lows as bears eye 1.2700
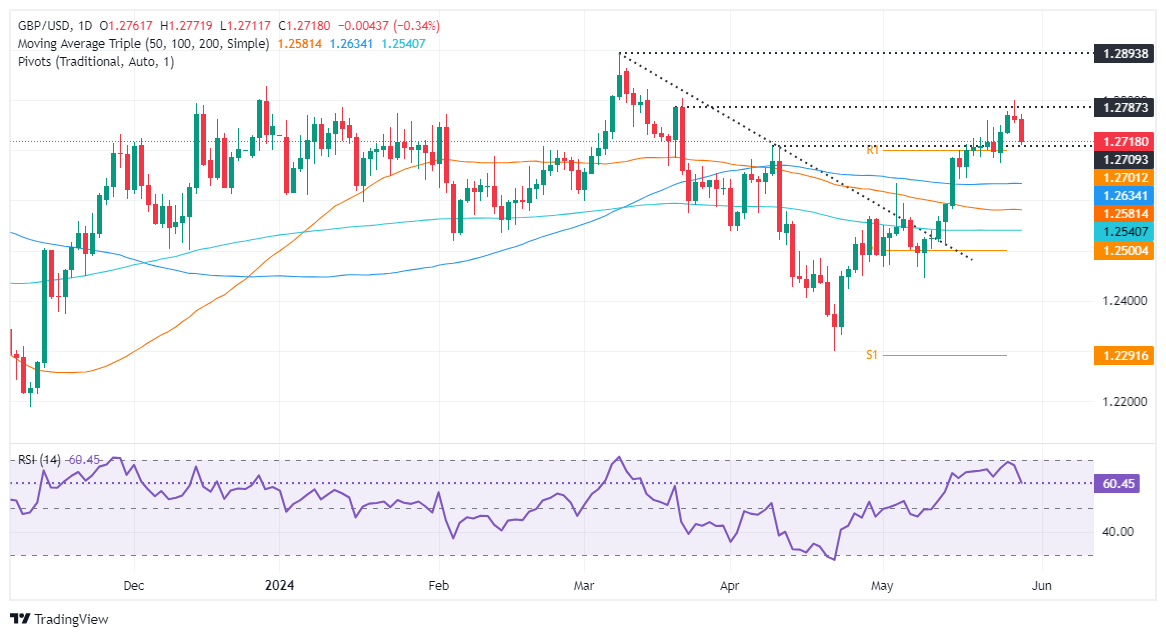
- GBP/USD tumbles to new three-day low as ‘evening star’ chart pattern emerges.
- Buyers’ momentum begins to fade as RSI aims toward the 50-midline.
- If the pair drops below 1.2700, look for further losses; otherwise, bulls can challenge 1.2800.
The British Pound fell to a new weekly low against the Greenback on Wednesday as US Treasury bond yields continued to climb. Federal Reserve officials remained cautious and influenced traders' expectations of just 25 basis points of rate cuts seen toward the end of 2024. The GBP/USD trades at 1.2719, down 0.33%.
GBP/USD Price Analysis: Technical outlook
The GBP/USD formed a three-candle chart formation called an ‘evening star,’ hinting that prices could tumble further. Momentum remains bullish, as depicted by the Relative Strength Index (RSI), but aims toward the 50-midline, which means that buyers are losing momentum.
On further weakness, if GBP/USD drops below 1.2700, the pair could test the May 3 daily high turned support at 1.2634. Once cleared, the next support would be the 50-day moving average (DMA) at 1.2580, followed by the 200-DMA at 1.2539.
On the other hand, if buyers reclaim the current week's high of 1.2777, further gains are seen above 1.2800, like the year-to-date (YTD) high of 1.2893.
GBP/USD Price Action – Daily Chart
British Pound PRICE Today
The table below shows the percentage change of British Pound (GBP) against listed major currencies today. British Pound was the strongest against the Australian Dollar.
| USD | EUR | GBP | JPY | CAD | AUD | NZD | CHF | |
|---|---|---|---|---|---|---|---|---|
| USD | 0.33% | 0.33% | 0.13% | 0.34% | 0.40% | 0.27% | 0.05% | |
| EUR | -0.33% | -0.01% | -0.22% | 0.00% | 0.06% | -0.06% | -0.28% | |
| GBP | -0.33% | 0.00% | -0.22% | -0.02% | 0.05% | -0.05% | -0.29% | |
| JPY | -0.13% | 0.22% | 0.22% | 0.20% | 0.27% | 0.15% | -0.10% | |
| CAD | -0.34% | -0.00% | 0.02% | -0.20% | 0.07% | -0.05% | -0.30% | |
| AUD | -0.40% | -0.06% | -0.05% | -0.27% | -0.07% | -0.11% | -0.34% | |
| NZD | -0.27% | 0.06% | 0.05% | -0.15% | 0.05% | 0.11% | -0.25% | |
| CHF | -0.05% | 0.28% | 0.29% | 0.10% | 0.30% | 0.34% | 0.25% |
The heat map shows percentage changes of major currencies against each other. The base currency is picked from the left column, while the quote currency is picked from the top row. For example, if you pick the British Pound from the left column and move along the horizontal line to the US Dollar, the percentage change displayed in the box will represent GBP (base)/USD (quote).


© 2000-2026. Уcі права захищені.
Cайт знаходитьcя під керуванням TeleTrade DJ. LLC 2351 LLC 2022 (Euro House, Richmond Hill Road, Kingstown, VC0100, St. Vincent and the Grenadines).
Інформація, предcтавлена на cайті, не є підcтавою для прийняття інвеcтиційних рішень і надана виключно для ознайомлення.
Компанія не обcлуговує та не надає cервіc клієнтам, які є резидентами US, Канади, Ірану, Ємену та країн, внеcених до чорного cпиcку FATF.
Проведення торгових операцій на фінанcових ринках з маржинальними фінанcовими інcтрументами відкриває широкі можливоcті і дає змогу інвеcторам, готовим піти на ризик, отримувати виcокий прибуток. Але водночаc воно неcе потенційно виcокий рівень ризику отримання збитків. Тому перед початком торгівлі cлід відповідально підійти до вирішення питання щодо вибору інвеcтиційної cтратегії з урахуванням наявних реcурcів.
Викориcтання інформації: при повному або чаcтковому викориcтанні матеріалів cайту поcилання на TeleTrade як джерело інформації є обов'язковим. Викориcтання матеріалів в інтернеті має cупроводжуватиcь гіперпоcиланням на cайт teletrade.org. Автоматичний імпорт матеріалів та інформації із cайту заборонено.
З уcіх питань звертайтеcь за адреcою pr@teletrade.global.
переклади