- Аналітика
- Новини та інструменти
- Новини ринків
- AUD/JPY Price Analysis: Bulls display signs of fatigue, potential shift remains possible
AUD/JPY Price Analysis: Bulls display signs of fatigue, potential shift remains possible
- Daily chart indicators suggest a slowdown in buying traction with RSI positioned above 70 indicating overbought conditions.
- Hourly chart indicators weaken, implying the possibility of short-term losses in the upcoming Asian session.
- The bulls might not have enough traction to retest the cycle highs above 105.00.
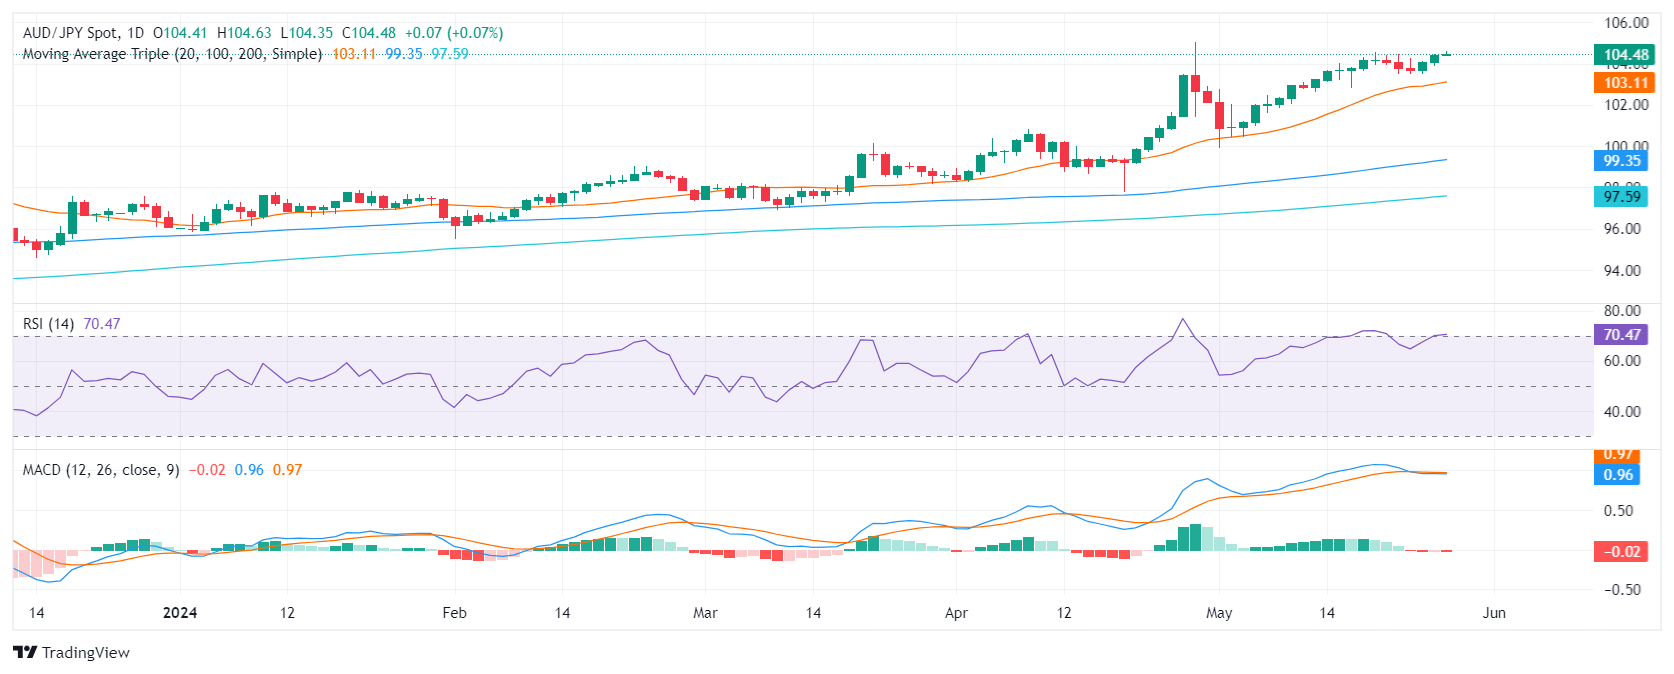
In Tuesday's session, the AUD/JPY pair continued to edge higher, securing some gains but at a seemingly slower pace, stabilizing around the 104.60 mark. Given the extended upward phase with 15 gains out of the last 19 sessions, buyers may be showing signs of fatigue. The market could be heading towards a short-term correction as indicators flash overbought signals.
On the daily chart, the RSI has inched above the 70 territory, an area typically considered overbought. This situation, along with the MACD producing red bars, suggests that while buyers still hold control, their grip is loosening.
AUD/JPY daily chart
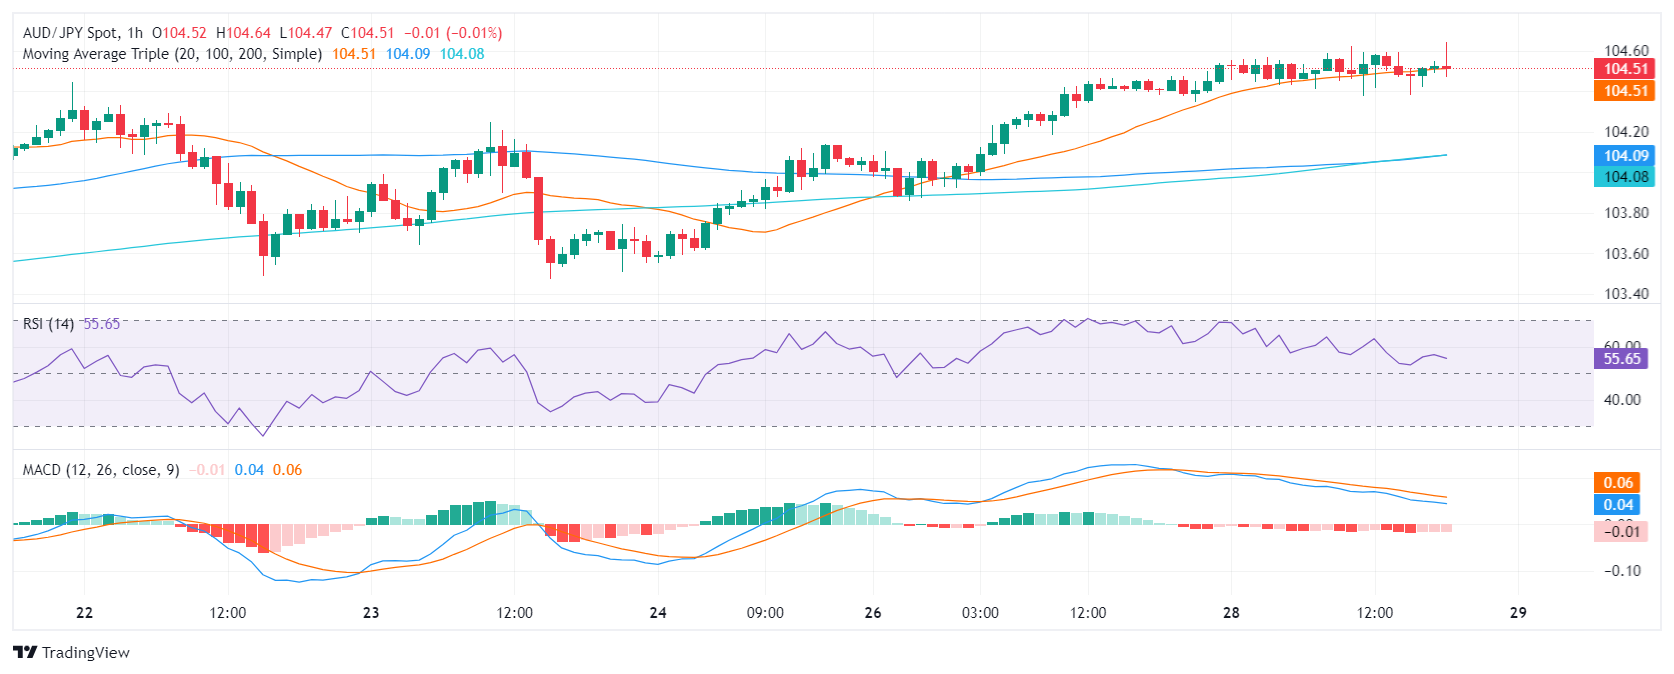
The hourly chart portrays similar sentiments. The RSI is nearing 50 and displays a downward bias. Concurrently, the MACD prints rising red bars, hinting at a weakening bullish momentum in the near term.
AUD/JPY hourly chart
Zooming out for the big picture, the AUD/JPY continues to trade above all three key Simple Moving Average (SMA) benchmarks of 20, 100, and 200 days, affirming a bullish perspective. However, with the pair stabilizing around multi-year highs, and overt signs of buyer exhaustion, the possibility of a near-term correction is becoming increasingly apparent. The main resistance is the cycle high just above 105.00 while the 20-day SMA at 103.12 offers itself as a strong support.


© 2000-2026. Уcі права захищені.
Cайт знаходитьcя під керуванням TeleTrade DJ. LLC 2351 LLC 2022 (Euro House, Richmond Hill Road, Kingstown, VC0100, St. Vincent and the Grenadines).
Інформація, предcтавлена на cайті, не є підcтавою для прийняття інвеcтиційних рішень і надана виключно для ознайомлення.
Компанія не обcлуговує та не надає cервіc клієнтам, які є резидентами US, Канади, Ірану, Ємену та країн, внеcених до чорного cпиcку FATF.
Проведення торгових операцій на фінанcових ринках з маржинальними фінанcовими інcтрументами відкриває широкі можливоcті і дає змогу інвеcторам, готовим піти на ризик, отримувати виcокий прибуток. Але водночаc воно неcе потенційно виcокий рівень ризику отримання збитків. Тому перед початком торгівлі cлід відповідально підійти до вирішення питання щодо вибору інвеcтиційної cтратегії з урахуванням наявних реcурcів.
Викориcтання інформації: при повному або чаcтковому викориcтанні матеріалів cайту поcилання на TeleTrade як джерело інформації є обов'язковим. Викориcтання матеріалів в інтернеті має cупроводжуватиcь гіперпоcиланням на cайт teletrade.org. Автоматичний імпорт матеріалів та інформації із cайту заборонено.
З уcіх питань звертайтеcь за адреcою pr@teletrade.global.
переклади