- Аналітика
- Новини та інструменти
- Новини ринків
- GBP/USD Price Analysis: Stays firm despite retreating at 1.2800 as bears loom
GBP/USD Price Analysis: Stays firm despite retreating at 1.2800 as bears loom
- GBP/USD maintains gains at 1.2786, up 0.14% from daily high.
- Resistance trendline and overbought RSI hint at potential correction.
- Short-term bearish engulfing pattern signals possible downward pressure.
The British Pound demonstrated its resilience against the Greenback on Tuesday, maintaining its gains as traders in the UK and the US returned after a long weekend. The GBP/USD is currently trading at 1.2786, showing a steady increase of 0.14% from its daily high of 1.2800.
GBP/USD Price Analysis: Technical outlook
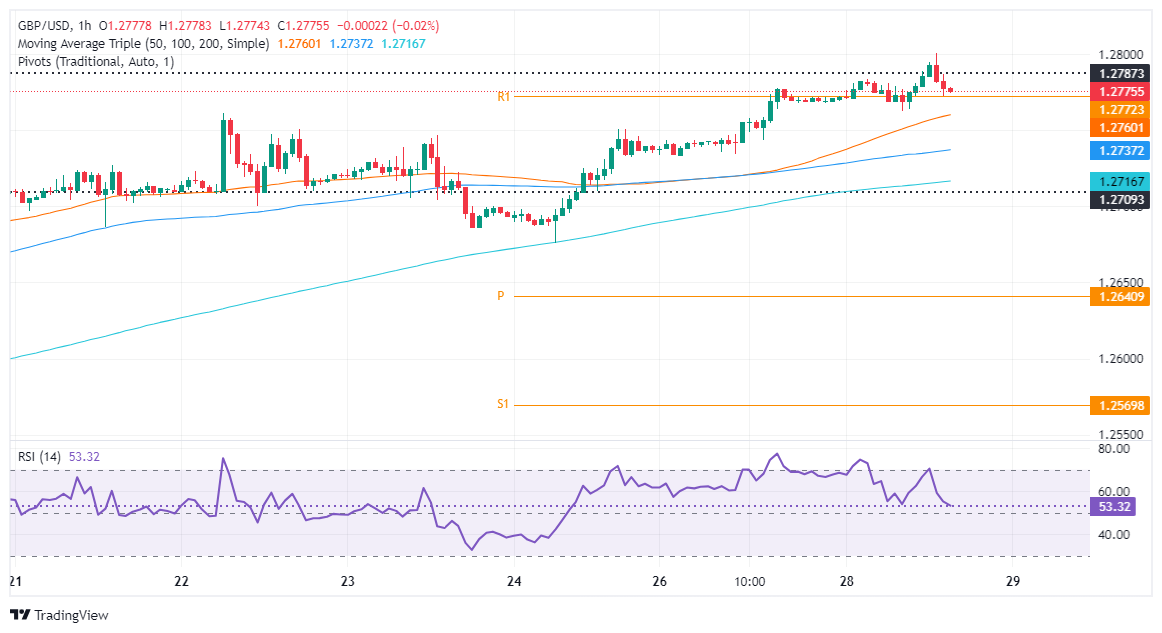
The GBP/USD tested the 1.2800 figure, yet a confluence of technical indicators with a downslope resistance trendline drawn from the highs of July 2023 and the March 21 cycle high at around 1.2803, pushed the exchange rate back to current spot prices. Momentum is in favor of buyers, but the Relative Strength Index (RSI) is about to turn overbought, hinting the pair could be headed for a correction.
In the short term, the GBP/USD hourly chart has formed a ‘bearish engulfing’ candle chart pattern, an indication that a leg-down is underway. Additionally, bullish momentum is fading as the Relative Strength Index (RSI) aims toward the 50 midline, which, once crossed, could exert downward pressure on the major.
Key support levels lie at the current day’s low of1.2762, followed by the confluence of the 50-simple moving average (SMA) at 1.2759, followed by the confluence of the100-SMA and the S1 pivot point at around 1.2736/39, ahead of the 200-SMA at 1.2716.
Conversely, if buyers stepped in and pushed prices above 1.2803, look for a re-test of the year-to-date (YTD) high of 1.2893.
GBP/USD Price Action – Hourly Chart


© 2000-2026. Уcі права захищені.
Cайт знаходитьcя під керуванням TeleTrade DJ. LLC 2351 LLC 2022 (Euro House, Richmond Hill Road, Kingstown, VC0100, St. Vincent and the Grenadines).
Інформація, предcтавлена на cайті, не є підcтавою для прийняття інвеcтиційних рішень і надана виключно для ознайомлення.
Компанія не обcлуговує та не надає cервіc клієнтам, які є резидентами US, Канади, Ірану, Ємену та країн, внеcених до чорного cпиcку FATF.
Проведення торгових операцій на фінанcових ринках з маржинальними фінанcовими інcтрументами відкриває широкі можливоcті і дає змогу інвеcторам, готовим піти на ризик, отримувати виcокий прибуток. Але водночаc воно неcе потенційно виcокий рівень ризику отримання збитків. Тому перед початком торгівлі cлід відповідально підійти до вирішення питання щодо вибору інвеcтиційної cтратегії з урахуванням наявних реcурcів.
Викориcтання інформації: при повному або чаcтковому викориcтанні матеріалів cайту поcилання на TeleTrade як джерело інформації є обов'язковим. Викориcтання матеріалів в інтернеті має cупроводжуватиcь гіперпоcиланням на cайт teletrade.org. Автоматичний імпорт матеріалів та інформації із cайту заборонено.
З уcіх питань звертайтеcь за адреcою pr@teletrade.global.
переклади