- Аналітика
- Новини та інструменти
- Новини ринків
- AUD/JPY Price Analysis: Bulls maintain a positive stride, potential shift remains possible
AUD/JPY Price Analysis: Bulls maintain a positive stride, potential shift remains possible
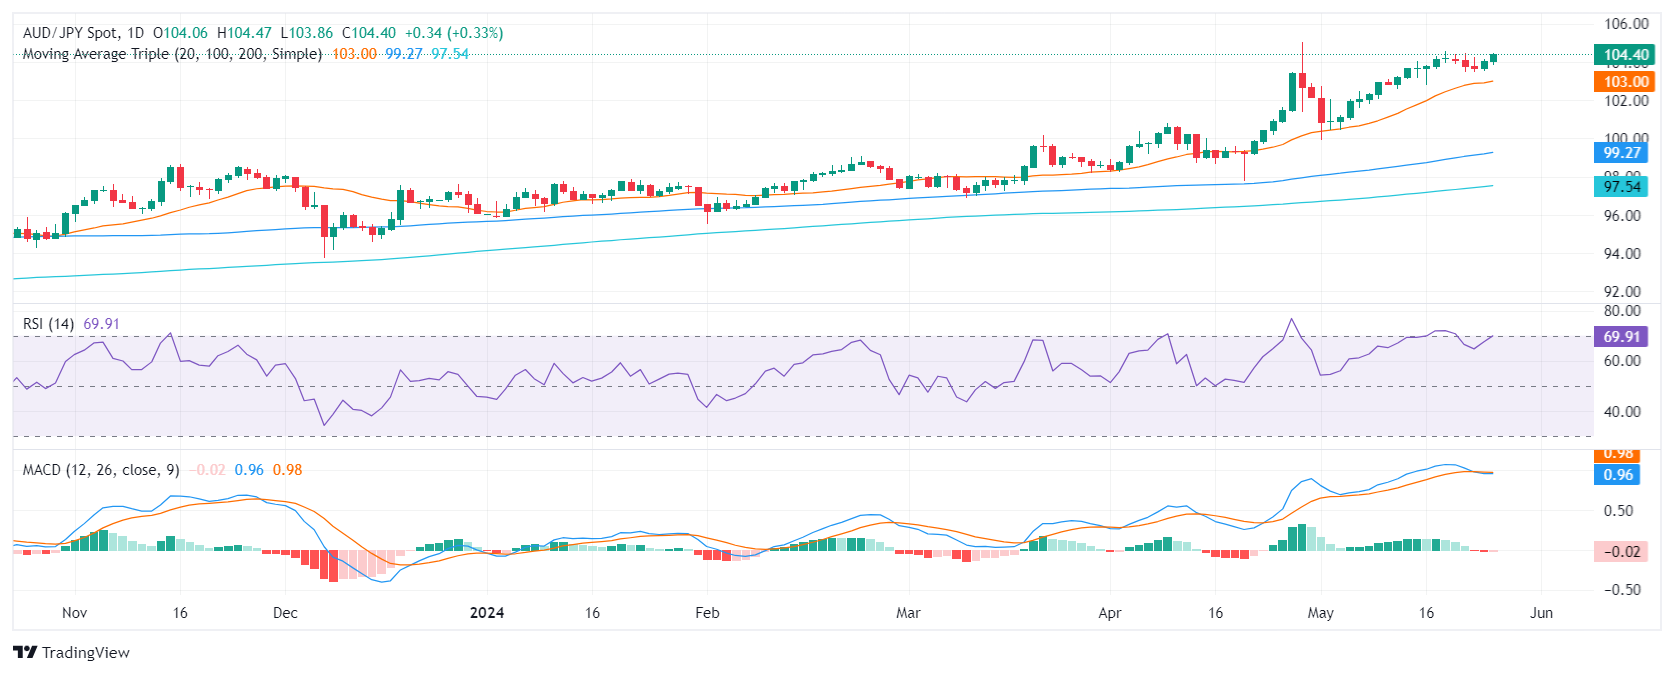
- Daily chart indicators depict a steady buying traction with RSI deep in positive area , but nearing overbought conditions.
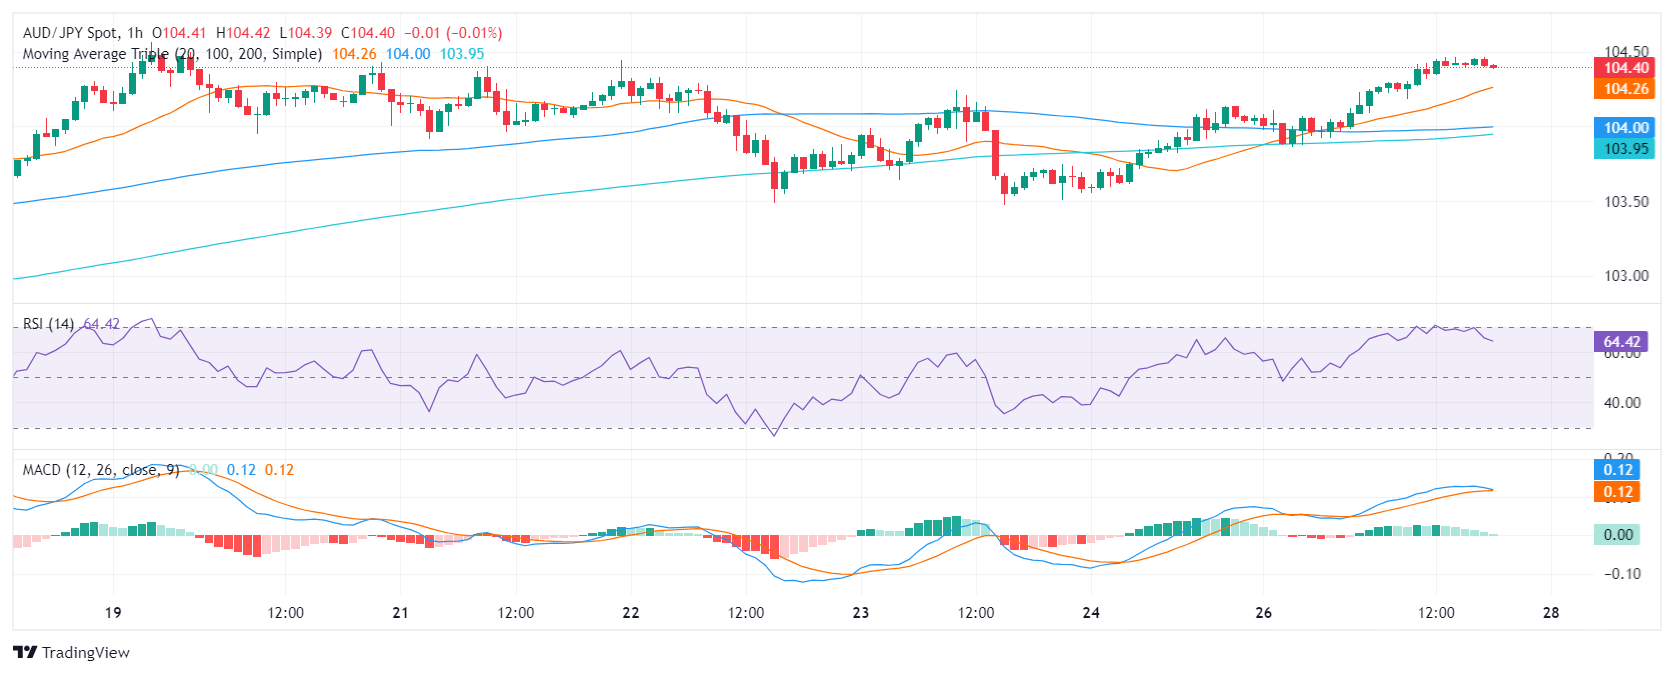
- On the hourly chart indicators are beginning to flatten, which suggests the cross may face some losses ahead of the Asian session.
- Given the heightened momentum, the stage could be set for a shift in market dominance, suggesting a potential correction on the horizon.
In Monday's session, the AUD/JPY pair managed to acquire supplementary momentum and saw some gains. Despite the strength of the buying momentum, the market may be heading for a correction since the Relative Strength Index (RSI) and Moving Average Convergence Divergence (MACD) hint at overbought levels. Ahead of the Asian session, with the pair nearing cyclical peaks, an incoming pullback for the cross may be on the horizon.
Examining the daily chart, the RSI is near the overbought territory. A gradual decrease from overbought conditions is evident while maintaining a positive trend, indicating buyers' dominance but hinting at a potential flattening. In line with that, the MACD shows a negative momentum as red bars are seen.
AUD/JPY daily chart
The hourly RSI values reveal a similar positive trend, with values hovering around the 60 mark but pointing downwards. This is backed by the MACD which prints decreasing green bars.
AUD/JPY hourly chart
In the broader context, the AUD/JPY is trading above all three key Simple Moving Average (SMA) benchmarks of 20, 100, and 200 days and this alignment suggests a strong bullish outlook for the pair. However, as the pair remains near cycle highs and due to the cross momentum becoming overextended, a correction could be imminent.


© 2000-2026. Уcі права захищені.
Cайт знаходитьcя під керуванням TeleTrade DJ. LLC 2351 LLC 2022 (Euro House, Richmond Hill Road, Kingstown, VC0100, St. Vincent and the Grenadines).
Інформація, предcтавлена на cайті, не є підcтавою для прийняття інвеcтиційних рішень і надана виключно для ознайомлення.
Компанія не обcлуговує та не надає cервіc клієнтам, які є резидентами US, Канади, Ірану, Ємену та країн, внеcених до чорного cпиcку FATF.
Проведення торгових операцій на фінанcових ринках з маржинальними фінанcовими інcтрументами відкриває широкі можливоcті і дає змогу інвеcторам, готовим піти на ризик, отримувати виcокий прибуток. Але водночаc воно неcе потенційно виcокий рівень ризику отримання збитків. Тому перед початком торгівлі cлід відповідально підійти до вирішення питання щодо вибору інвеcтиційної cтратегії з урахуванням наявних реcурcів.
Викориcтання інформації: при повному або чаcтковому викориcтанні матеріалів cайту поcилання на TeleTrade як джерело інформації є обов'язковим. Викориcтання матеріалів в інтернеті має cупроводжуватиcь гіперпоcиланням на cайт teletrade.org. Автоматичний імпорт матеріалів та інформації із cайту заборонено.
З уcіх питань звертайтеcь за адреcою pr@teletrade.global.
переклади