- Аналітика
- Новини та інструменти
- Новини ринків
- EUR/JPY Price Analysis: Bulls times might be up as indicators approach overbought territory
EUR/JPY Price Analysis: Bulls times might be up as indicators approach overbought territory
- The daily RSI and MACD remain in positive territory but suggest that consolidation may be incoming..
- The same indicators on the hourly chart hint also signal a possible consolidation phase subsequent to recent gains.
- The EUR/JPY's position above primary SMAs maintains long-term bullish sentiment.
In Monday's session, the EUR/JPY pair is trading mildly higher, showing continued dominance by the bulls. However, caution must be exercised due to signs of overbought conditions, which tend to be followed by downward movements
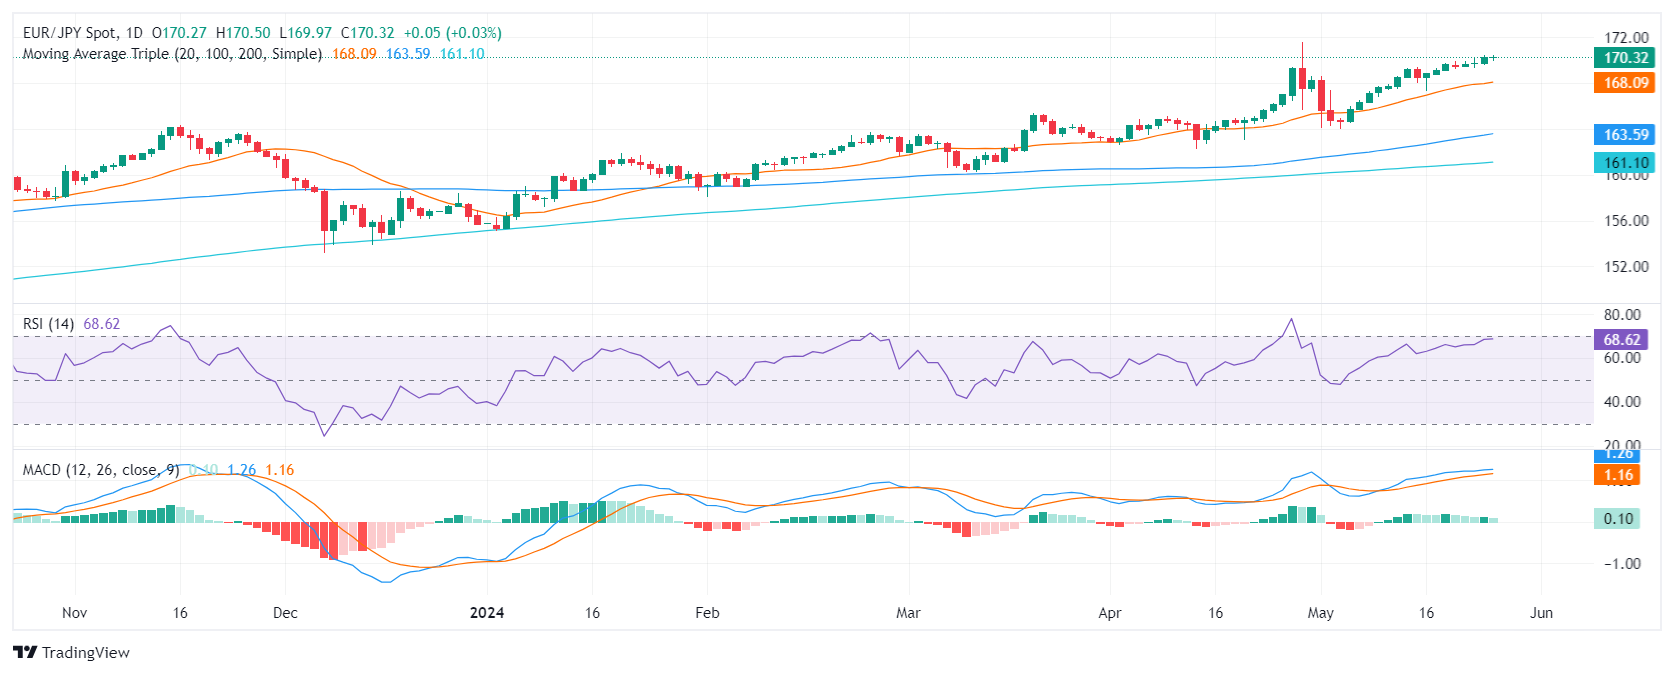
In the daily analysis, the Relative Strength Index (RSI) for the EUR/JPY pair has been observing a steady positive trend. It points out that buyers hold a strong position with the latest reading nearing overbought territory. Concurrently, the Moving Average Convergence Divergence (MACD) histogram fortifies this stance, demonstrating flat green bars symbolizing a steady but flattening positive momentum.
EUR/JPY daily chart
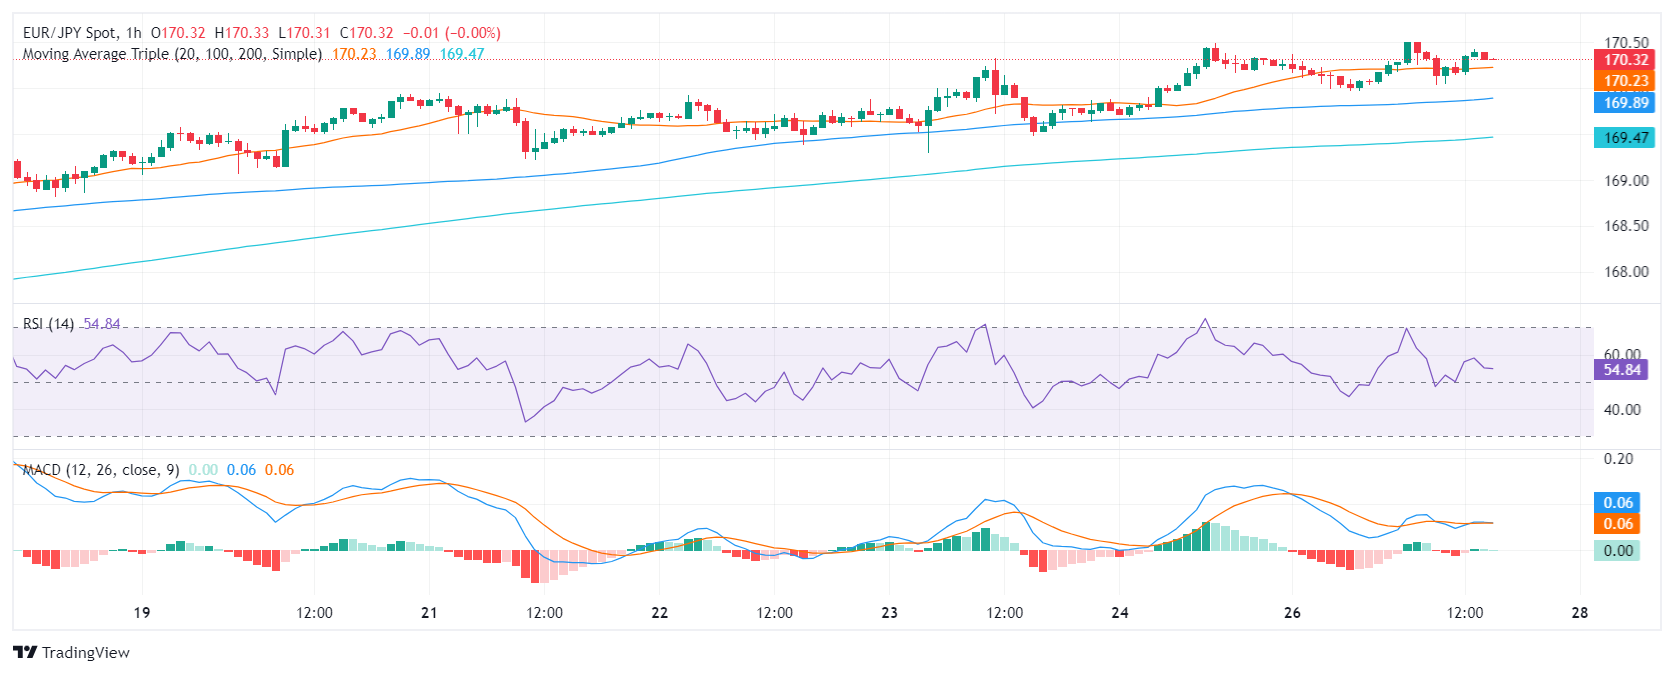
Transitioning to the hourly chart, the RSI has dipped from high-positive towards a negative slope, with the latest reading at 54, distancing itself from an earlier overbought condition. The MACD histogram also hints at a pace alteration, continuing to print flat green bars, implying a downturn in buying pressure.
EUR/JPY hourly chart
The EUR/JPY robust performance is highlighted by its position above the key Simple Moving Average (SMA) benchmarks at 20,100, and 200 days. However, a technical correction may be incoming but any movements which keep the pair above these levels could be considered as mere consolidation.


© 2000-2026. Уcі права захищені.
Cайт знаходитьcя під керуванням TeleTrade DJ. LLC 2351 LLC 2022 (Euro House, Richmond Hill Road, Kingstown, VC0100, St. Vincent and the Grenadines).
Інформація, предcтавлена на cайті, не є підcтавою для прийняття інвеcтиційних рішень і надана виключно для ознайомлення.
Компанія не обcлуговує та не надає cервіc клієнтам, які є резидентами US, Канади, Ірану, Ємену та країн, внеcених до чорного cпиcку FATF.
Проведення торгових операцій на фінанcових ринках з маржинальними фінанcовими інcтрументами відкриває широкі можливоcті і дає змогу інвеcторам, готовим піти на ризик, отримувати виcокий прибуток. Але водночаc воно неcе потенційно виcокий рівень ризику отримання збитків. Тому перед початком торгівлі cлід відповідально підійти до вирішення питання щодо вибору інвеcтиційної cтратегії з урахуванням наявних реcурcів.
Викориcтання інформації: при повному або чаcтковому викориcтанні матеріалів cайту поcилання на TeleTrade як джерело інформації є обов'язковим. Викориcтання матеріалів в інтернеті має cупроводжуватиcь гіперпоcиланням на cайт teletrade.org. Автоматичний імпорт матеріалів та інформації із cайту заборонено.
З уcіх питань звертайтеcь за адреcою pr@teletrade.global.
переклади