- Аналітика
- Новини та інструменти
- Новини ринків
- GBP/USD Price Analysis: Shooting star emerges as sellers eye 1.2600
GBP/USD Price Analysis: Shooting star emerges as sellers eye 1.2600
- GBP/USD slides 0.04%, peaking at 1.2746 in early North American trading.
- Technicals show a bearish trend with a 'shooting star' pattern and momentum with sellers.
- Support on May 21 low of 1.2686, May 16 low of 1.2643, and 1.2600 psychological level.
- Resistance at 50-hour SMA (1.2721), 100-hour SMA (1.2712), weekly high of 1.2761; potential target at 1.2800.
Early during the North American session, the British Pound dropped against the Greenback after data from the United States showed that business activity was picking up. Alongside that, inflationary pressures rose, sparking investors' fears that the Fed would delay cutting rates later during the year. The GBP/USD trades at 1.2711 after hitting a high of 1.2746, down 0.04%
GBP/USD Price Analysis: Technical outlook
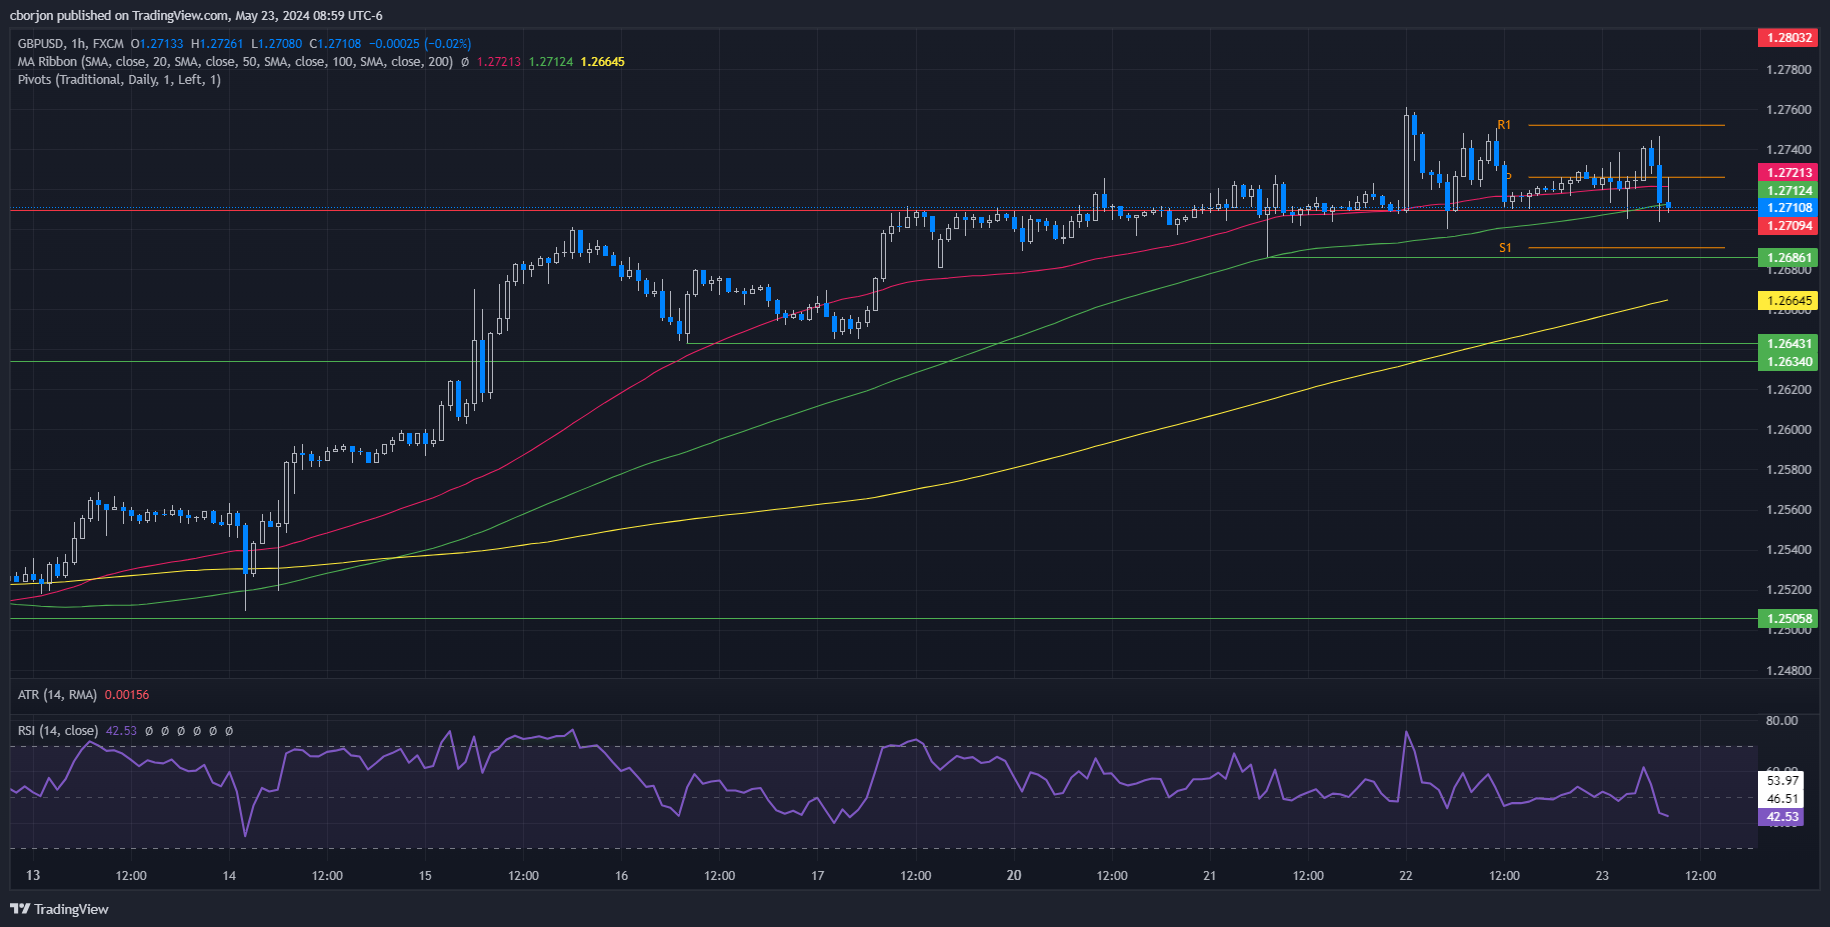
The GBP/USD edges are lower after printing a ‘shooting star’ on Wednesday, a prelude to lower prices. Today’s price action witnessed a jump toward a high of 1.2750, but it still failed to crack the current week’s high of 1.2761, which opened the door for further losses.
In the short term, the GBP/USD one-hour chart suggests the pair is range-bound, capped on the upside by the 50-hour SMA at 1.2721 and the 100-hour SMA at 1.2712. However, momentum supports sellers, as shown by the Relative Strength Index (RSI), which remains bearish and hovers at its lowest level since May 17.
Therefore, if the major drops beneath 1.2700, the next support would be the May 21 low of 1.2686, followed by the May 16 low of 1.2643 and the psychological 1.2600 mark.
Conversely, if buyers lift the exchange rate above 1.2746, that will sponsor a test of the weekly high of 1.2761. Further strength and the pair could aim for 1.2800.
GBP/USD Price Action – Hourly Chart


© 2000-2026. Уcі права захищені.
Cайт знаходитьcя під керуванням TeleTrade DJ. LLC 2351 LLC 2022 (Euro House, Richmond Hill Road, Kingstown, VC0100, St. Vincent and the Grenadines).
Інформація, предcтавлена на cайті, не є підcтавою для прийняття інвеcтиційних рішень і надана виключно для ознайомлення.
Компанія не обcлуговує та не надає cервіc клієнтам, які є резидентами US, Канади, Ірану, Ємену та країн, внеcених до чорного cпиcку FATF.
Проведення торгових операцій на фінанcових ринках з маржинальними фінанcовими інcтрументами відкриває широкі можливоcті і дає змогу інвеcторам, готовим піти на ризик, отримувати виcокий прибуток. Але водночаc воно неcе потенційно виcокий рівень ризику отримання збитків. Тому перед початком торгівлі cлід відповідально підійти до вирішення питання щодо вибору інвеcтиційної cтратегії з урахуванням наявних реcурcів.
Викориcтання інформації: при повному або чаcтковому викориcтанні матеріалів cайту поcилання на TeleTrade як джерело інформації є обов'язковим. Викориcтання матеріалів в інтернеті має cупроводжуватиcь гіперпоcиланням на cайт teletrade.org. Автоматичний імпорт матеріалів та інформації із cайту заборонено.
З уcіх питань звертайтеcь за адреcою pr@teletrade.global.
переклади